Test- FTSE 100 Kicks Off August on a High as BP and Senior Lead Market Momentum
$11
10 Oct 2025, 13:13
Neutral
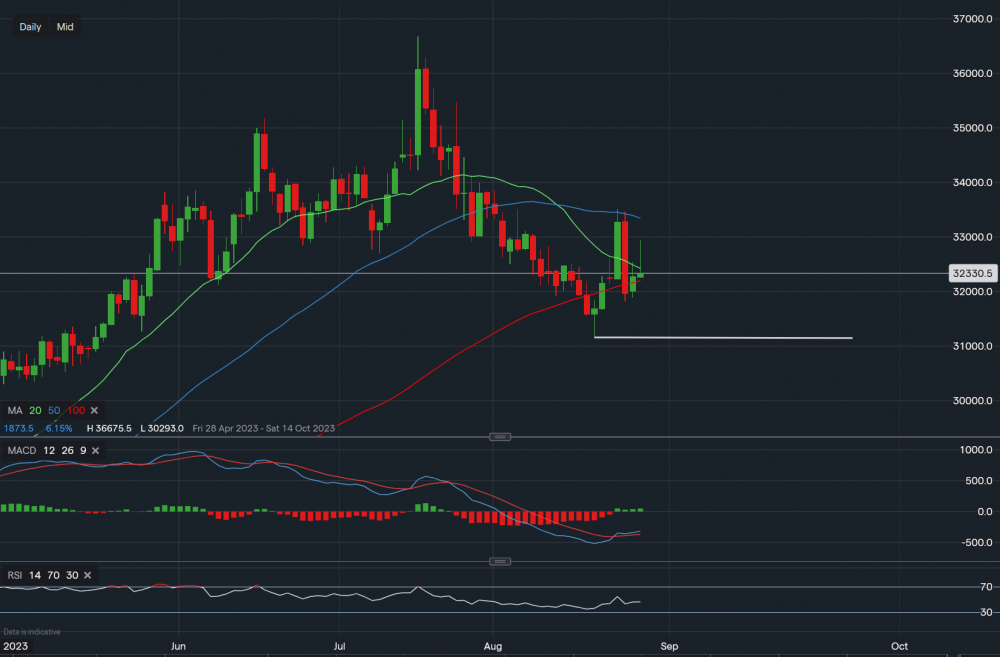
Chart & Data from IG
Taking a look at Microsoft, currently its stock is trading at around $323.30 a share. We can see the tech giant has had a sizeable sell-off during the month, it has formed somewhat of a bottom for the time being at $311.56. This level is now the key support for the near future (highlighted by white trendline), a break below it would suggest that further downside is possible going into the September month. However, when we apply the simple moving averages to the chart, we can see that support still exists along the 100-day MA ($321.94). We would prefer to see some clear consolidation around current levels before aiming for any upside, but based on the moving averages, minor resistance sits at $324.10 (20-day MA). A move and close above it could see a stretch towards the 50-day MA, which reads $333.39. The technical indicators are mixed, the MACD is flat and the RSI suggest a neutral stance as it reads 46.

Tradable assets:
Min.Deposit:
Max Leverage:
FCA:

Rating:


