Test- FTSE 100 Kicks Off August on a High as BP and Senior Lead Market Momentum
$11
10 Oct 2025, 13:13
Neutral
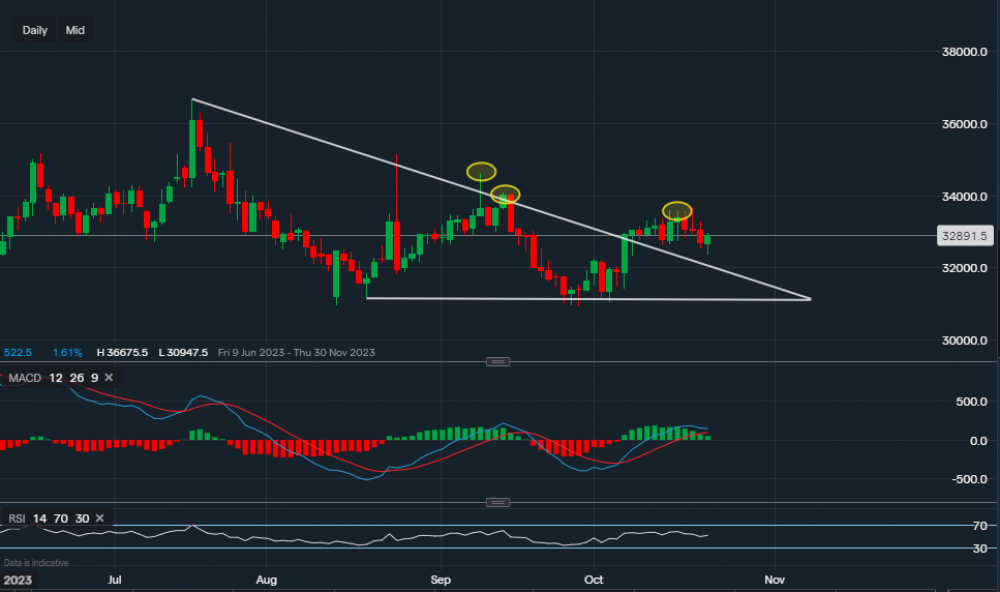
Chart & Data from IG
Microsoft is expected to report its quarterly earnings tomorrow. Currently, the company’s shares are trading at around $328.91 a share. From a technical standpoint, the price has broken out of the descending triangle pattern drawn on the chart, however, the bearish trend persists as the stock faces some challenging resistance points. Those are highlighted by the yellow ovals, with the first level at $355.80. A break above this level would then need to face levels of $340.85 followed by $346.20. A move above $346.20 would be a strong indication that the longer-term bull run has resumed. Support sits at $325.47 (yesterday’s low), the price did actually break below earlier in the session but has now climbed above it. A close below may see a move lower back towards the descending trendline of the triangle ($320.08). The technical indicators are more optimistic as the MACD is positive and the RSI reads 52 (neutral and rising). However, the MACD volume has now lowered and the MACD is edging closer to the signal line.

Tradable assets:
Min.Deposit:
Max Leverage:
FCA:

Rating:


