Test- FTSE 100 Kicks Off August on a High as BP and Senior Lead Market Momentum
$11
10 Oct 2025, 13:13
Neutral
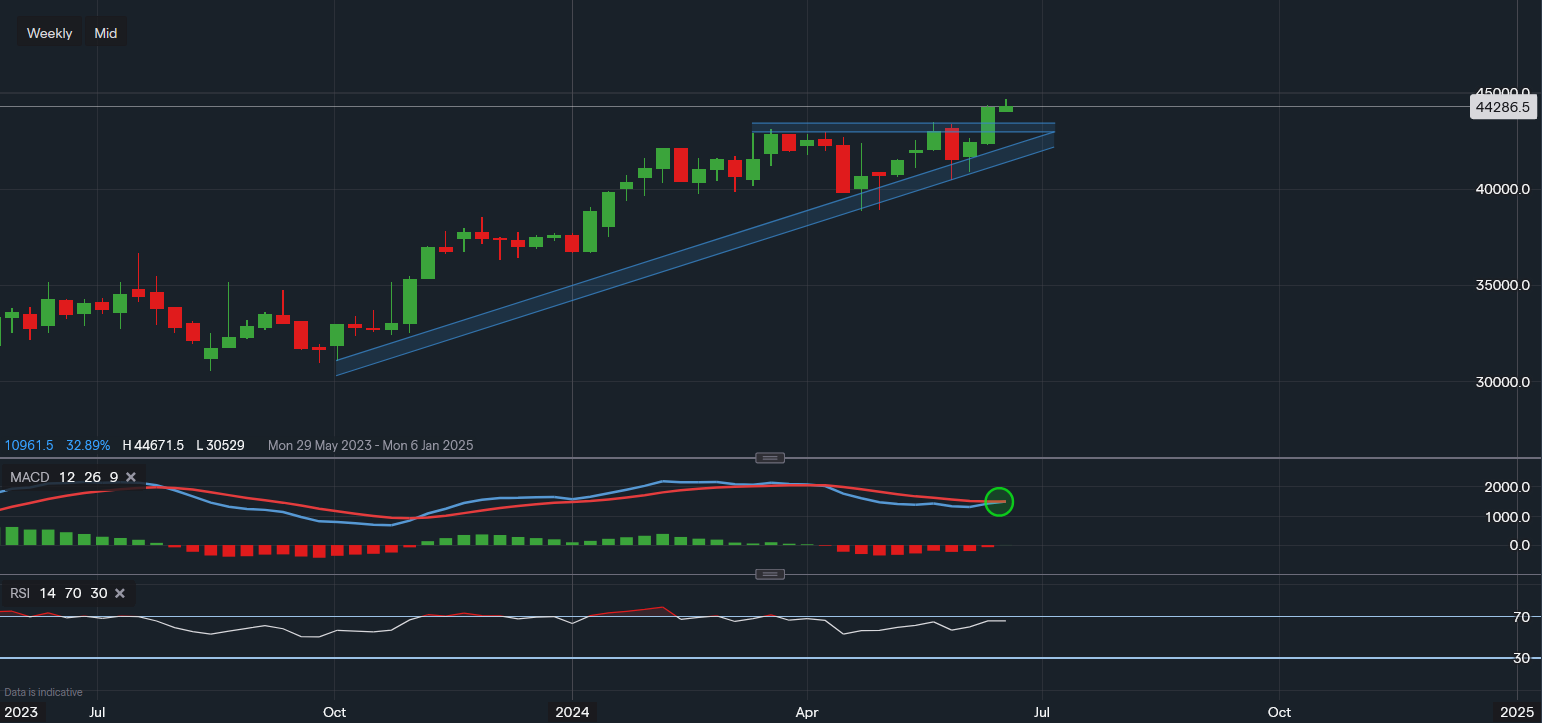
Chart & Data from IG
A potential breakout here for Microsoft on the weekly chart. We can see the share price of the tech giant has moved and closed strongly above the resistance of $434.72 last week. Suggesting bullish momentum for the short term. With the price trading higher, we may see a small pullback for a re-test of this breakout for further confirmation. The previous resistance of $434.72 should now act as support in the short term, although this is not guaranteed and the price could continue higher. As MSFT is trading at all-time highs, there is no resistance above. However, it can be argued that the next psychological resistance is the $450 price level. Towards the downside, a move below the previous breakout resistance of $434.72 may lead to a pullback as low as $420 in order to re-test the April-May consolidation period. Looking at the technical indicators, the MACD seems like it could now turn positive once again and the RSI is already positive as it reads 65.

Tradable assets:
Min.Deposit:
Max Leverage:
FCA:

Rating:


