Test- FTSE 100 Kicks Off August on a High as BP and Senior Lead Market Momentum
$11
10 Oct 2025, 13:13
Neutral
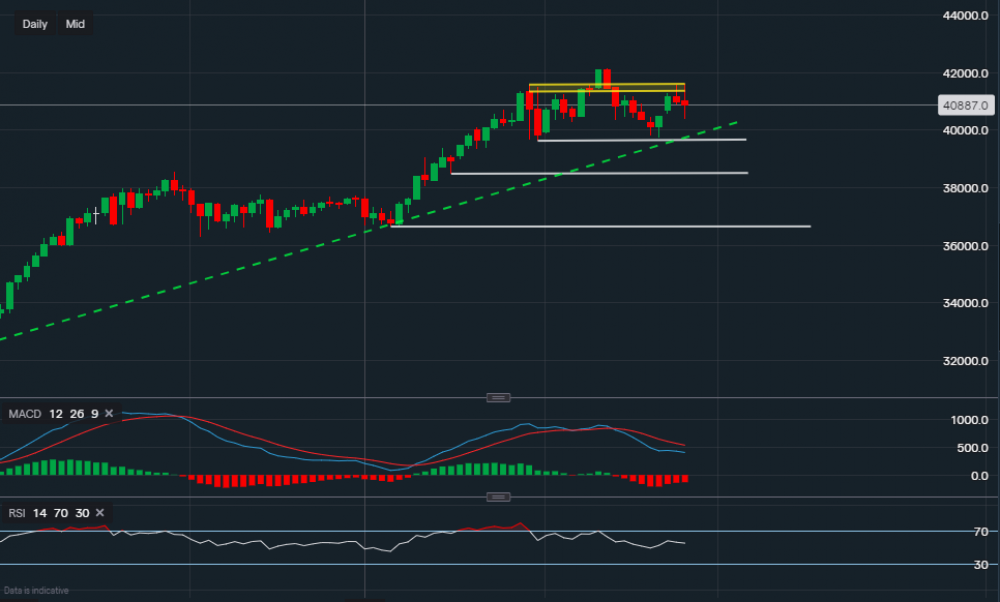
Chart & Data from IG
Potential head and shoulders formation here for Microsoft on the daily chart. Currently, its shares are down 0.3% on the day and trading at around $408.87 a share. The ‘shoulders’ are marked by the yellow channel on the chart, with resistance between $415-$416. A break of the resistance would disregard the potential bearish formation and would allow the bulls to then look towards the all-time high of $421.41, or in other words, the potential ‘head’. Towards the downside, the support is along the ascending trendline (green), which reads $398.46. However, only a break below the support of $396.30 would indicate that further downside movement is likely. In that case, the focus would then shift towards the support of $384.85. Looking at the technical indicators, the MACD on the daily is negative but the RSI remains only just positive as it reads 55. The indicators suggest a mixed outlook for the short term, which may be the case until a break in the range of $396-$416 occurs.

Tradable assets:
Min.Deposit:
Max Leverage:
FCA:

Rating:


