Test- FTSE 100 Kicks Off August on a High as BP and Senior Lead Market Momentum
$11
10 Oct 2025, 13:13
Neutral
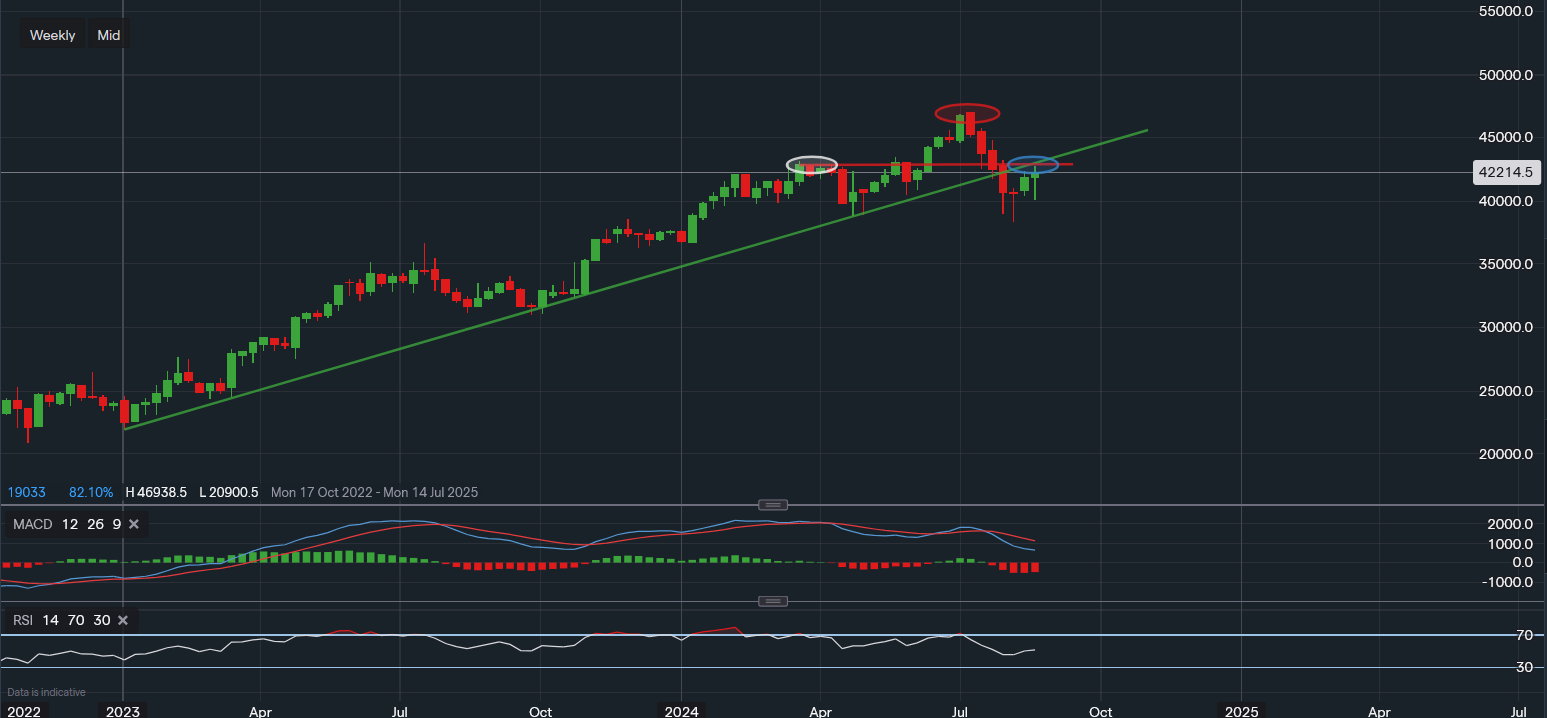
Chart & Data from IG
Microsoft’s share price trying to climb its way back up above the supportive trendline, which is currently acting as resistance reading around $429. A move above it would not necessarily indicate that a leg higher is then underway as there is resistance also between $431.32-$434.72. Only a break above this area would create greater confidence for the bulls to possibly see more upside in MSFT in the medium term. Currently, its shares are trading at around $422.14 a share and so far are flat on the day. As of right now, there is a slight chance of a possible head and shoulder formation looking at the weekly chart, which has been clearly outlined using the ovals and red trendline. A rejection along the red/green trendline meeting point could result in a near-term sell-off forced by the short-sellers both institutional and retail (bears). Therefore, towards the downside, the key support levels can be found at $404.72 then at $397.24, and then at the low of August, which reads $383.11. A break below $383.11 would likely create some concerns, perhaps seeing a decline towards the $360-$370 area. Looking at the technical indicators, the outlook is still somewhat foggy. The MACD is negative but seems like it’s trying to consolidate following last week’s rally. The RSI has neutralised as it now reads 51 but is still rather flat to confirm any major shift in momentum.

Tradable assets:
Min.Deposit:
Max Leverage:
FCA:

Rating:


