Test- FTSE 100 Kicks Off August on a High as BP and Senior Lead Market Momentum
$11
10 Oct 2025, 13:13
Neutral
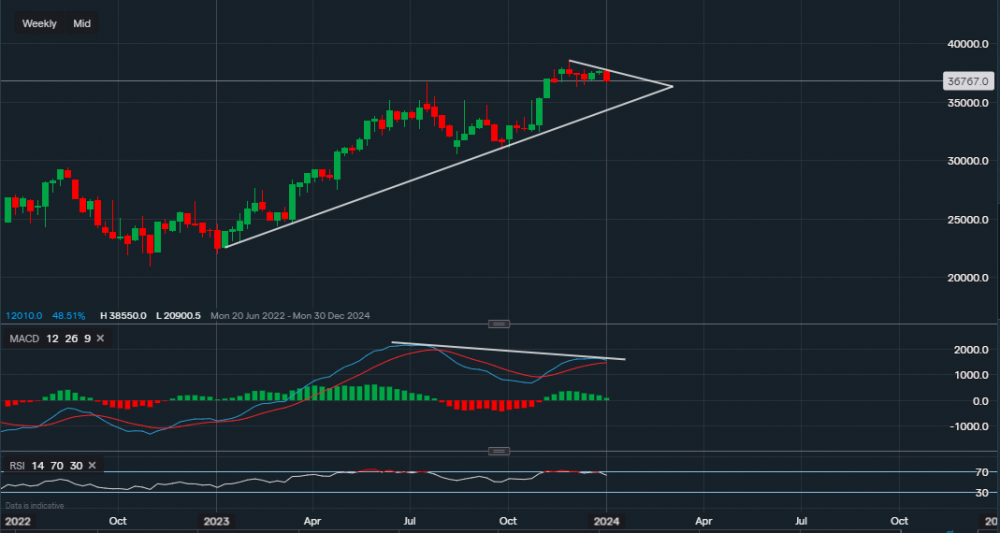
Chart & Data from IG
Taking a look at Microsoft as it seems a slight bearish divergence may be forming. Currently, its stock is trading at around $367.67 a share. From a technical viewpoint, we can see that so far the price has been rejected along the trendline resistance, which reads $377.06. Due to the rejection, the focus is now shifting towards the support levels of $364.20 and $362.91. A break below $362.91 would increase the likelihood of a potential pullback towards the supportive trendline, or respectively, $350 a share. If we look deeper into the chart and glance over at the technical indicators, we can see that the MACD is suggesting a bearish divergence. When the price of a stock creates a higher high but the indicator does the opposite, i.e. lower high, this can be an indication of a divergence. The trendline drawn on the MACD supports this, as well as the low volume portrayed by the histogram. However, this is not guaranteed as a break above the trendline resistance could quite frankly see the price continue higher. But until then, it can be argued that the bias is shifting towards the bears here. The RSI is also starting to falter as it now reads 63, though still positive.

Tradable assets:
Min.Deposit:
Max Leverage:
FCA:

Rating:


