Test- FTSE 100 Kicks Off August on a High as BP and Senior Lead Market Momentum
$11
10 Oct 2025, 13:13
Neutral
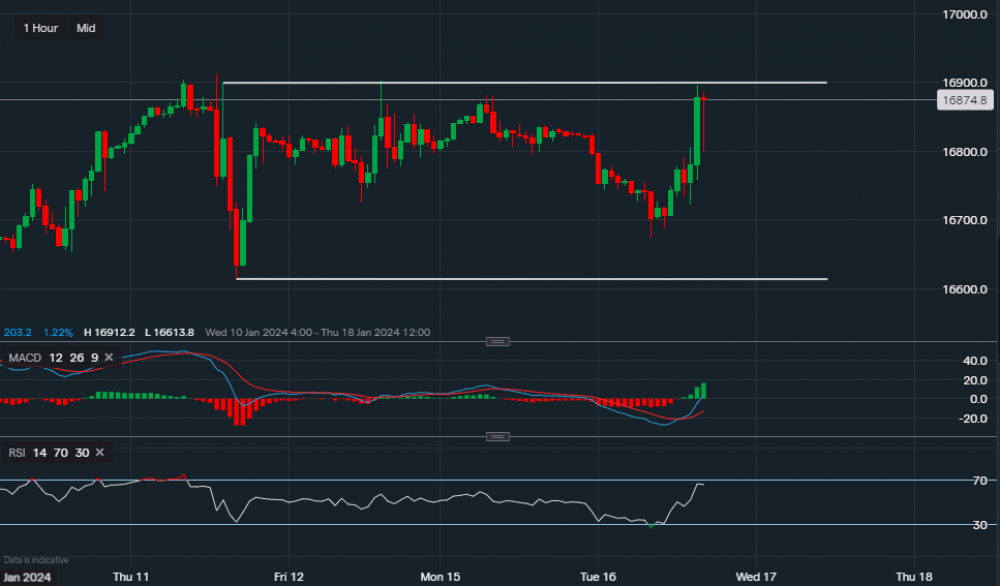
Chart & Data from IG
The Nasdaq is nearing the resistance of 16,900, which has proven resilient so far. Currently, the index is trading at around 16,874. A break and close above this resistance would suggest that a possible extension is underway back towards 16,978 (an all-time high). If there is yet another rejection then we may see a slide back down towards the lower half of the channel, with the key support levels on the 1-hour chart reading 16,673 followed by 16,613 (lower trendline). A break and close below the lower trendline would indicate that downside pressure has increased and a move towards 16,500 is likely. Looking at the technical indicators for this timeframe, the MACD has just turned positive and so is the RSI as it reads 64. Important to note that shorter timeframes can be deceiving as longer timeframes can have more influence on price fluctuations.

Tradable assets:
Min.Deposit:
Max Leverage:
FCA:

Rating:


