Test- FTSE 100 Kicks Off August on a High as BP and Senior Lead Market Momentum
$11
10 Oct 2025, 13:13
Neutral
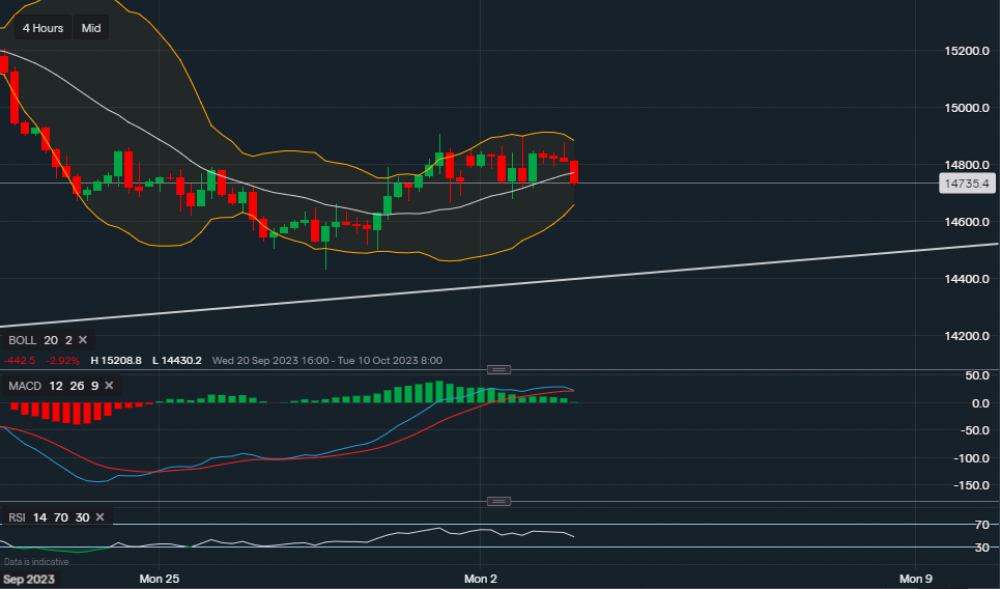
Chart & Data from IG
Taking a look at the Nasdaq on the 4-hourly interval, currently, the tech-heavy index is trading at around 14,735. It seems like the resistance along the upper Bollinger Band is proving to be overpowering as the index has tried to climb higher on two occasions but has been rejected. It is now falling below the middle moving average of the Bollingers, it may slide towards the lower band where support sits at 14,656. A break below this support level could see the bands expand and see the Nasdaq slide lower towards the base support of 14,430 (formed last Wednesday). However, if there is some consolidation along the lower band we could see another attempt to push higher (resistance at 14,905). A break above 14,905 could result in an extension towards 15,200. Nevertheless, the technical indicators are lagging but starting to support the negative bias as the MACD seems like it will turn negative, and the RSI has now turned neutral.

Tradable assets:
Min.Deposit:
Max Leverage:
FCA:

Rating:


