Test- FTSE 100 Kicks Off August on a High as BP and Senior Lead Market Momentum
$11
10 Oct 2025, 13:13
Neutral
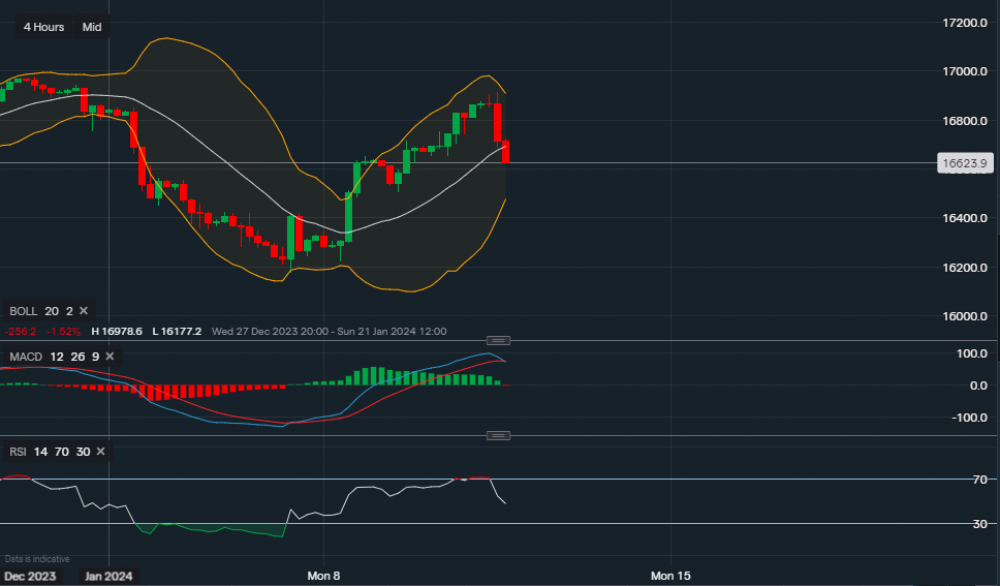
Chart & Data from IG
Taking a look at the NASDAQ as it seems to be crossing the middle moving average of the Bollinger Bands. Currently, the tech-heavy index is trading at around 16,623, and we can see that the middle moving average reads 16,694. If the current 4-hourly candlestick closes below this moving average, then we could see a further move towards the lower bands of the Bollingers. The lower band currently reads 16,480. It would be unreliable to speak of any resistance areas at this moment in time as the short-term bias has shifted toward negative due to the inflation data. Looking at the technical indicators, the MACD seems like it could turn negative with the MACD line now touching its signal line. The RSI has also fallen sharply as it's now in a neutral stance reading 48.

Tradable assets:
Min.Deposit:
Max Leverage:
FCA:

Rating:


