Test- FTSE 100 Kicks Off August on a High as BP and Senior Lead Market Momentum
$11
10 Oct 2025, 13:13
Neutral
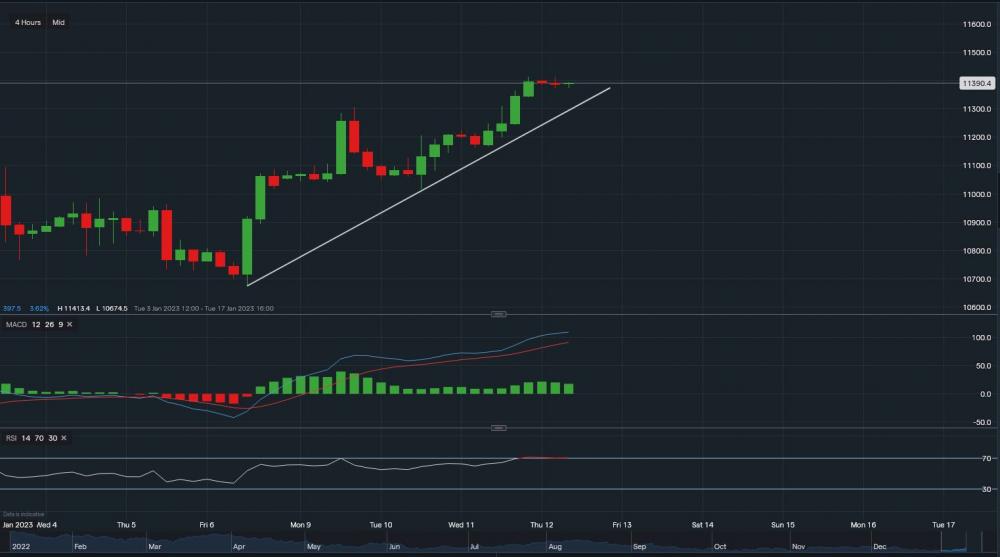
Nasdaq - Chart & Data from IG
Nasdaq has been on the green side since last Friday as investors bet on the CPI figures to highlight a slowing in inflation. This in turn could prompt the Federal Reserve to ease off on the interest rate hikes. Comments have been made over the past week that a drop in inflation may sway the Fed to raise rates by 25 basis points, rather than the 50 initially planned. From a technical outlook, the index is currently trading at around 11,390 with key resistance sitting at 11,413. A break above this resistance level could see the Nasdaq rise towards the 11,500 mark. Support levels below sit at 11,373 then at 11,342 then at 11,326 (rests on the white trendline). A break below 11,326 may see the index fall as low as 11,200. Looking at the technical indicators, MACD is currently positive and so is RSI as it reads 71. However, RSI is 'overbought' so a slight short-term dip could occur. Note to investors: YoY CPI figures are due at 13:30 GMT, which are expected to show inflation growth to slow to 6.5% from 7.1%. A reading that is weaker tends to be supportive (bullish) for the indices, and a reading that is stronger tends to be negative (bearish).

Tradable assets:
Min.Deposit:
Max Leverage:
FCA:

Rating:


