Test- FTSE 100 Kicks Off August on a High as BP and Senior Lead Market Momentum
$11
10 Oct 2025, 13:13
Neutral
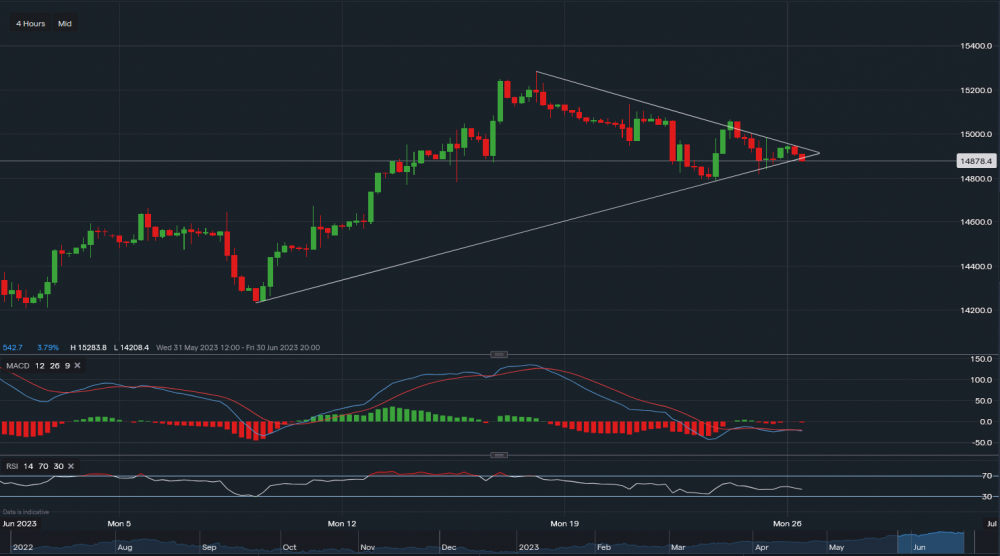
Chart & Data from IG
Nasdaq seems like it is struggling to maintain the upside momentum, we can see that on the 4 hourly timeframe it tried to break out of the triangle on Friday last week. But it turned out to be a false breakout and the index quickly retraced. Currently trading at around 14,878, it has dipped below the supportive trendline of the triangle, or respectively, the support level of 14,884. It is now approaching the support at 14,818, a break below this level could see a retracement lower towards 14,787 which is the next key level. At the moment, the support level of 14,884 is now acting as resistance. A break and close above this level may see a rise higher towards the resistance sitting at 14,950. Although, investor bias has now switched to bearish. Looking at the technical indicators, MACD has turned slightly negative and so has the RSI as it now reads 42.

Tradable assets:
Min.Deposit:
Max Leverage:
FCA:

Rating:


