Test- FTSE 100 Kicks Off August on a High as BP and Senior Lead Market Momentum
$11
10 Oct 2025, 13:13
Neutral
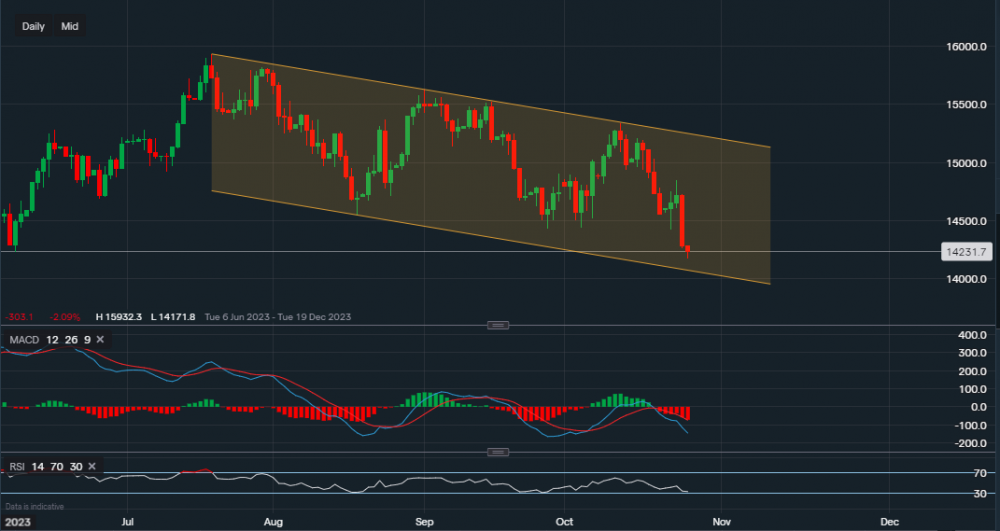
Chart & Data from IG
The Nasdaq remains within this downward channel, it has now broken below the support of 14,430. Currently, the tech-heavy index is trading at around 14,231 and heading towards the lower band of the channel where support reads 14,073. A break below this level could see a further slide towards 13,520. The short-term bias has turned bearish once again, hence, it would be unreliable to point out any resistance levels until signs of some consolidation are clear. The softer-than-expected earnings are weighing heavy, the US economy is showing signs of resilience and the desired cooling by the Fed is not going to plan so far. The Fed is due to announce its decision on the future of interest rates in the early days of next month, which will hopefully help investors determine the future of this index and stocks witthin. If we head over to the technical indicators, we can see that the MACD is strongly negative and so is the RSI as it reads 33.

Tradable assets:
Min.Deposit:
Max Leverage:
FCA:

Rating:


