Test- FTSE 100 Kicks Off August on a High as BP and Senior Lead Market Momentum
$11
10 Oct 2025, 13:13
Neutral
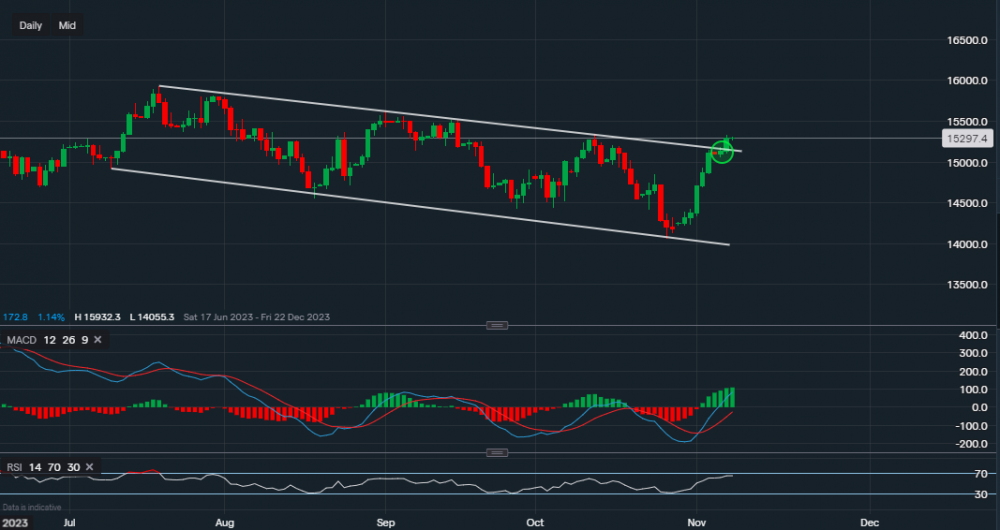
Chart & Data from IG
The Nasdaq seems like it has now broken out of the downward channel, currently trading at around 15,297. But it is not clear that it has now re-entered the previous bull run from the start of the year, as a pullback is possible to re-test trendline support (green oval – previous resistance). The index has recorded 7 green days in a row, for the first time in quite some time. Due to this rally, some profit-taking as well as pressure from the bears could restrict further gains going into the end of the week. Fed chair Jerome Powell is set to speak today which also may influence the markets, especially this tech-heavy index. Resistance now sits at 15,339, the index came close to testing this yesterday but ran out of steam. A break and close above this level could see a further move towards 15,520 and then 15,628. Support now sits along the upper trendline of the channel reading 15,142. A break and close back in the channel may lead to downside pressure, potentially seeing a slip towards 14,939. Looking at the technical indicators, they demonstrate a very optimistic outlook. The MACD is strongly positive and the RSI reads 65.

Tradable assets:
Min.Deposit:
Max Leverage:
FCA:

Rating:


