Test- FTSE 100 Kicks Off August on a High as BP and Senior Lead Market Momentum
$11
10 Oct 2025, 13:13
Neutral
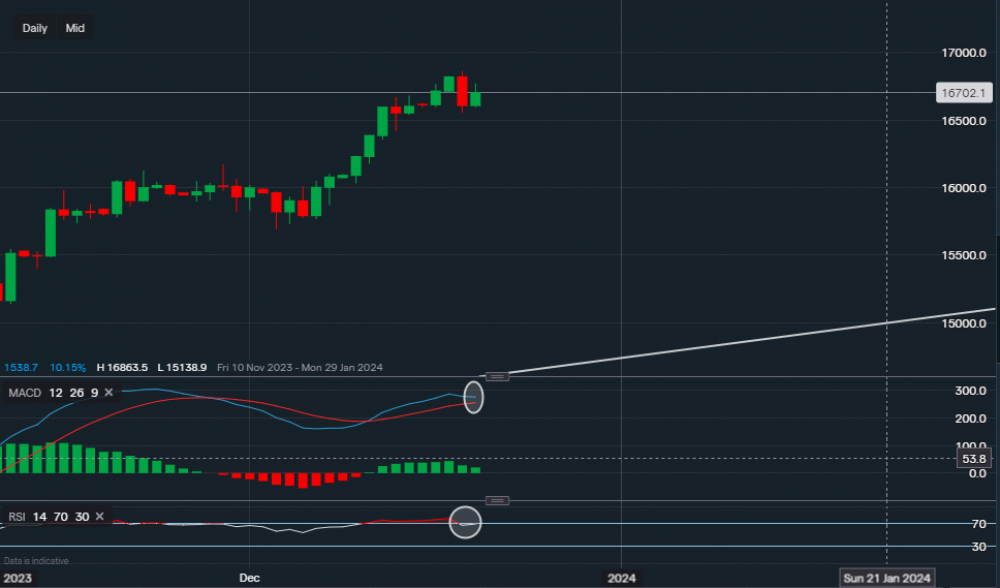
Chart & Data from IG
Taking a look at the Nasdaq 100 index as signs of cooling are lingering. Currently, the index is trading at around 16,702. We can see that an engulfing candlestick appeared yesterday with the price closing lower than the previous two days, in theory, this is a bearish indication. The index rose in pre-market trading but tech stocks are looking a little shaky after the recent US economic data, which showed that less jobless claims have been last month. This only puts a minor strain on the Fed's outlook but creates caution among investors as the markets are in overbought conditions right now. The next point of support here is yesterday’s low of 16,551, a break below it could then see a further pullback towards 16,418. The resistance here now is today’s high of 16,771, followed by this year’s high of 16,863. However, unless the index moves above 16,771 then caution should be considered before expecting moves higher. Looking at the technical indicators, the MACD is still positive but volume has lowered and the MACD line has curved slightly. The RSI was indicating overbought conditions but it has now edged lower as it reads 68.

Tradable assets:
Min.Deposit:
Max Leverage:
FCA:

Rating:


