Test- FTSE 100 Kicks Off August on a High as BP and Senior Lead Market Momentum
$11
10 Oct 2025, 13:13
Neutral
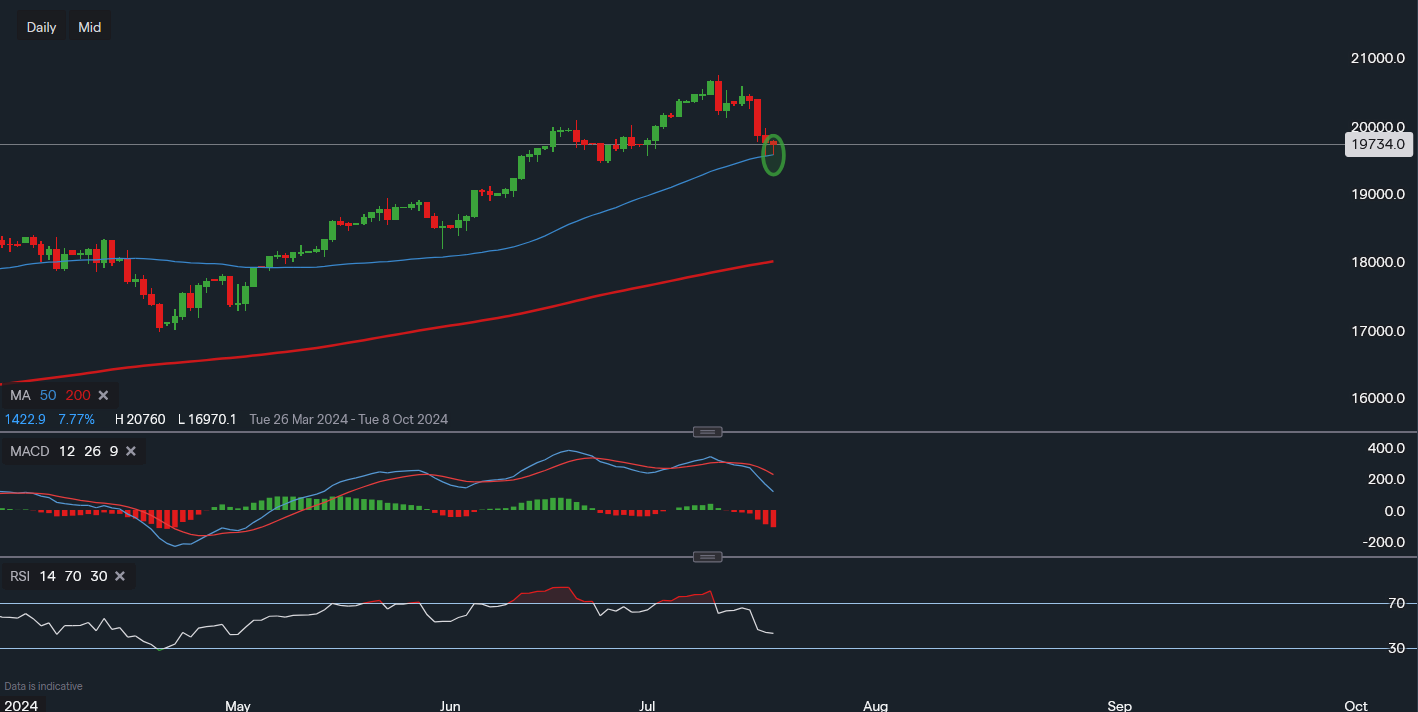
Chart & Data from IG
Seems like the 50-day moving average is providing temporary support here for Nasdaq. The index has now retraced around 5% from its ATHs and is currently trading at around 19,734. The 50MA is reading 19,582 and the index actually dipped just below touching 19,576, clearly so far this is just technical support with the US session taking the attention. A dip and close below the 50MA to finish the week but create the risk of a further decline next week, especially with some heavyweights due to report their earnings. In that scenario, traders may then look to support around 18,900 and maybe even as low as 19,200. In theory, by the time a decline of such degree was to reach 18,200, the 200MA would most likely correspond with this level. Therefore, this would then be classed as a major support level for the mid-term. However, positive earnings from some of the market leaders could create some support in the near term and lower the severity of any possible declines throughout the summer period. It would be unreliable to point out any resistance levels as the bias is swaying in favour of the bears, however, a move above 20,087 may shift this outlook. The technical indicators clearly demonstrate that bearish momentum is now at play with both in the negative territory.

Tradable assets:
Min.Deposit:
Max Leverage:
FCA:

Rating:


