Test- FTSE 100 Kicks Off August on a High as BP and Senior Lead Market Momentum
$11
10 Oct 2025, 13:13
Neutral
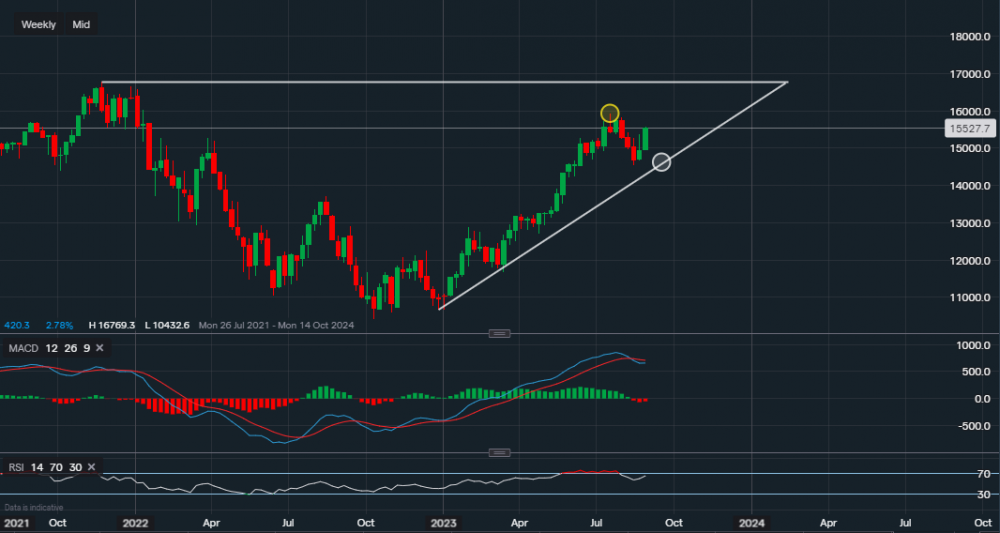
Chart & Data from IG
Taking a look at the Nasdaq after the strong bounce this week, following optimism from cooling inflation data. Currently, the index is trading at around 15,527, resistance above sits at 15,708 and then the key level at 15,932 (yellow oval). A break above the key level would then suggest that we may see a move higher towards the all-time high of 16,769. However, there is important data due later today, any resilience in the labour market will prompt the Fed to either keep rates for longer or even increase them, in turn putting pressure on the markets. So, towards the downside, the support sits at 15,422 then at 14,920 and then at 14,553 (white oval – supportive trendline). A break and close below the trendline would be a suggestion that there may be further downside, with the aim of around 14,000. However, this would have to be analysed at the time. Looking at the technical indicators, MACD is still negative but the RSI is still positive as it reads 65.

Tradable assets:
Min.Deposit:
Max Leverage:
FCA:

Rating:


