Test- FTSE 100 Kicks Off August on a High as BP and Senior Lead Market Momentum
$11
10 Oct 2025, 13:13
Neutral
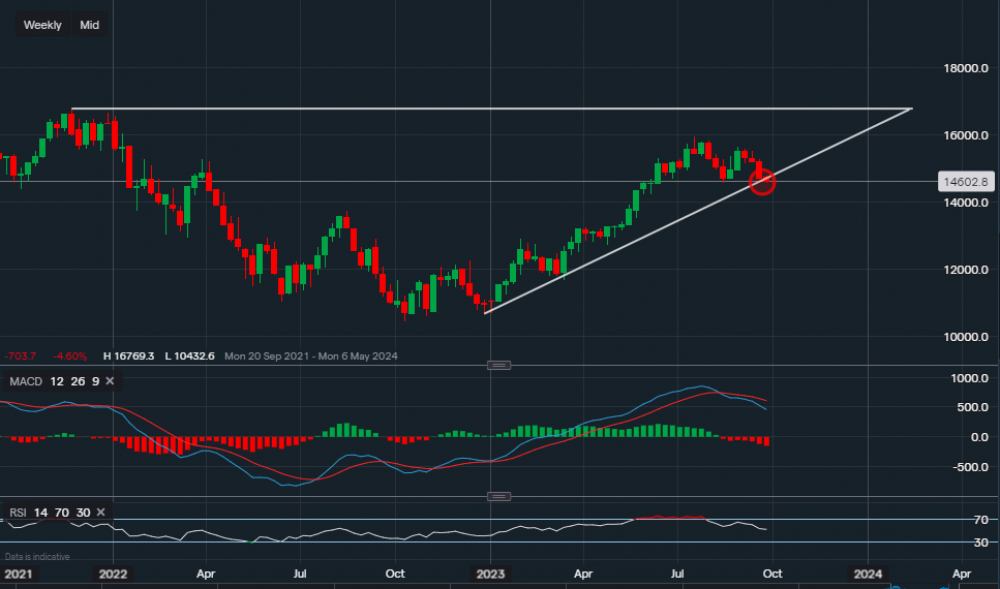
Chart & Data from IG
The Nasdaq is now trading at around 14,602 and we can see that the tech-heavy index has approached a key level of support on the weekly interval, which is highlighted by the red oval. This support of 14,553 is still being tested as the lowest point so far reached has been 14,560. A break and close this week below 14,553 could indicate that further downside is possible, and then we could see a move towards 14,233 in the following week. It would be unreliable to look at any resistance levels right now as the bias has turned bearish for the near-term unless we see a bounce back by the end of the week or consolidation along current levels. Looking at the history, September tends to be a negative month for US indices which increases the likelihood of more downside when the month comes to a close. If we look at the technical indicators, MACD is still negative and the RSI has now turned neutral as it reads 52.

Tradable assets:
Min.Deposit:
Max Leverage:
FCA:

Rating:


