Test- FTSE 100 Kicks Off August on a High as BP and Senior Lead Market Momentum
$11
10 Oct 2025, 13:13
Neutral
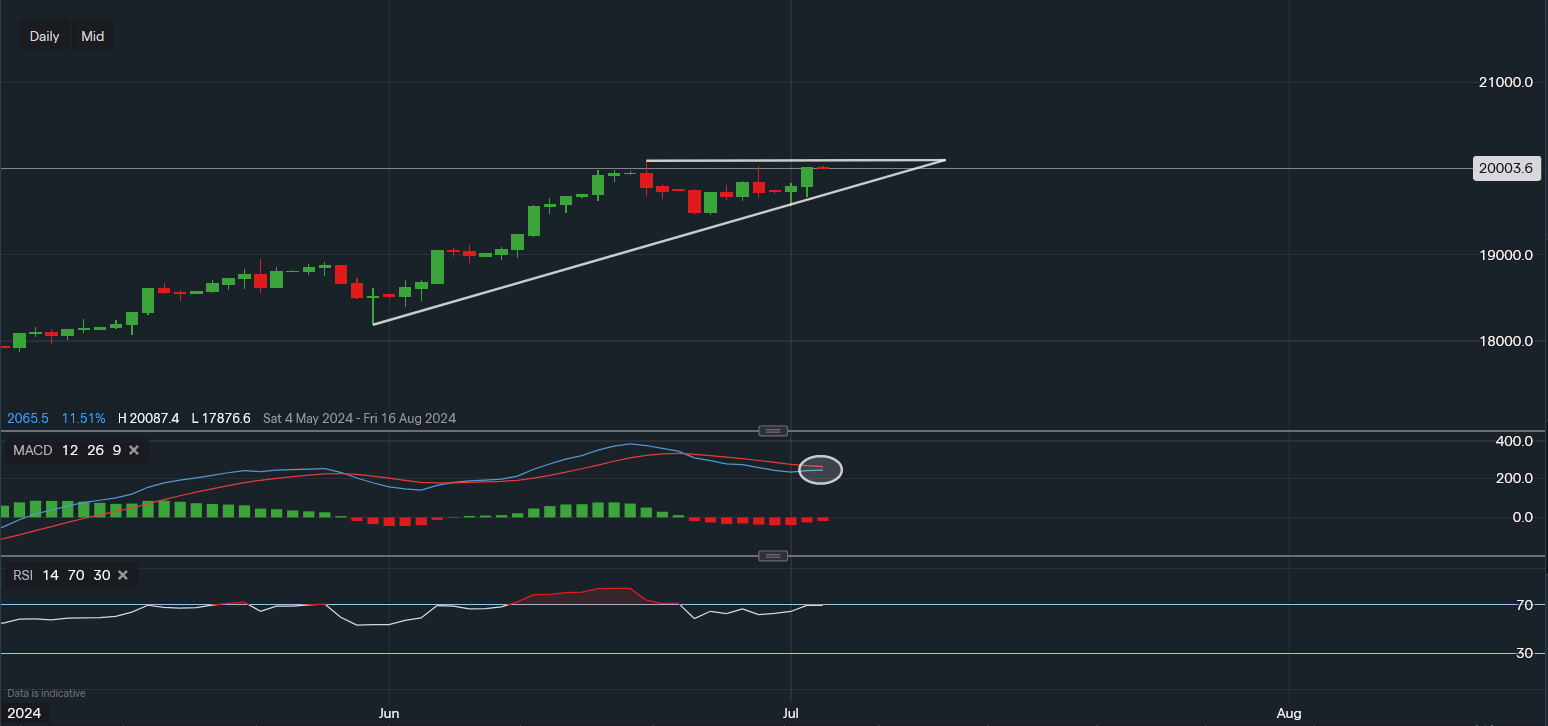
Chart & Data from IG
Nasdaq hovering around all-time highs after closing above 20,000 yesterday for the first time ever. Currently, the tech-heavy index is trading at around 20,003 in the pre-market trading session. Looking at the daily chart, there is some near term resistance at 20,087 before any further moves are to be considered. As the first week of July has started on a strong foot, we may see a test of this resistance in today’s session before the US holiday tomorrow. A break and close above this resistance would certainly indicate bullish momentum is still present, since there would be no clear resistance beyond this point, the next psychological level would be the area of 20,300-20,400 based on recently captured single day moves. However, with the jobs data due on Friday, we may see some sideways movement until then. Towards the downside, near term support sits along the ascending trendline, reading 19,678. A break below this level would see the bulls look towards levels 19,568 and then 19,459 for further price action. Looking at the indicators, they seem more bullish than bearish. The MACD seems to be curving higher and the RSI is already positive as it reads 69.

Tradable assets:
Min.Deposit:
Max Leverage:
FCA:

Rating:


