Test- FTSE 100 Kicks Off August on a High as BP and Senior Lead Market Momentum
$11
10 Oct 2025, 13:13

Chart & Data from IG

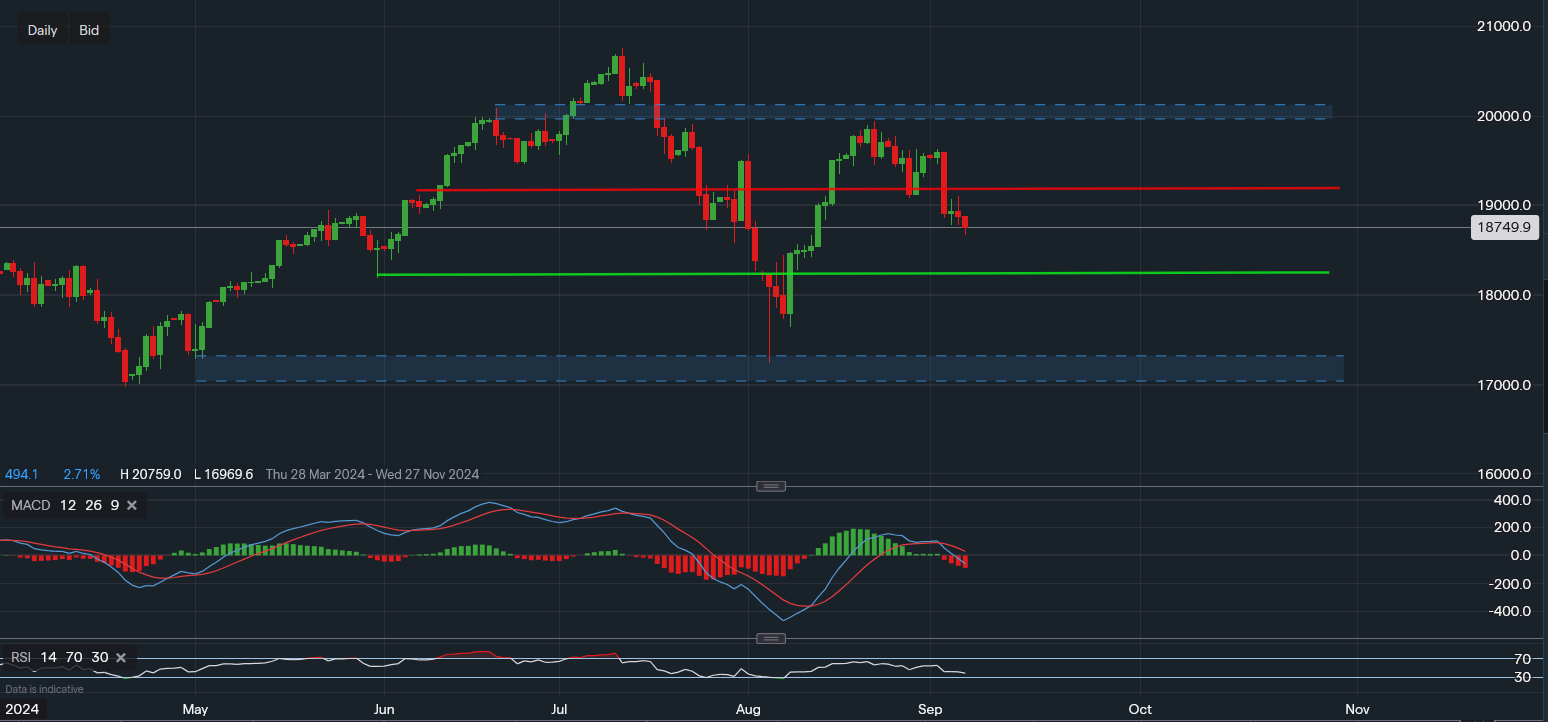
Taking a look at the Nasdaq 100 ahead of the jobs report. Currently, the index is trading at around a price level of 18,749, with clear support and resistance areas highlighted using the daily chart for the short-term outlook. The first key area of support is around 18,187 (green trendline). A break below this support level would certainly then shift the focus to the area highlighted using the blue channel (lower end of chart). This area support ranges between 16,969 and 17,242, which are the lows of April and August, and would become a vital point for the markets as a fall below it could cause real concerns in the medium-longer term outlook. However, this speculation is currently far-fetched and with a smaller likelihood percentage as of right now. Towards the upside, the first key level of support is around 19,114 (red trendline). A break and close above this level may create greater confidence amongst investors, leading to a rally towards the area ranging from 19,938 and 20,086. Securing a position above 20,000 would likely spark further optimism, potentially creating room for consolidation before a push higher to all-time highs. Nonetheless, with September being historically a poor month for returns, and October being the month just prior to the elections, high volatility is expected. In fact, the index may even be rangebound between 17,000-17,300 and 19,900-20,100 until after the elections and more economic data. Based on the technical indicators, the bias is more towards the downside. The MACD is now clearly bearish and the RSI is gradually slipping as it reads 39.