Test- FTSE 100 Kicks Off August on a High as BP and Senior Lead Market Momentum
$11
10 Oct 2025, 13:13
Neutral
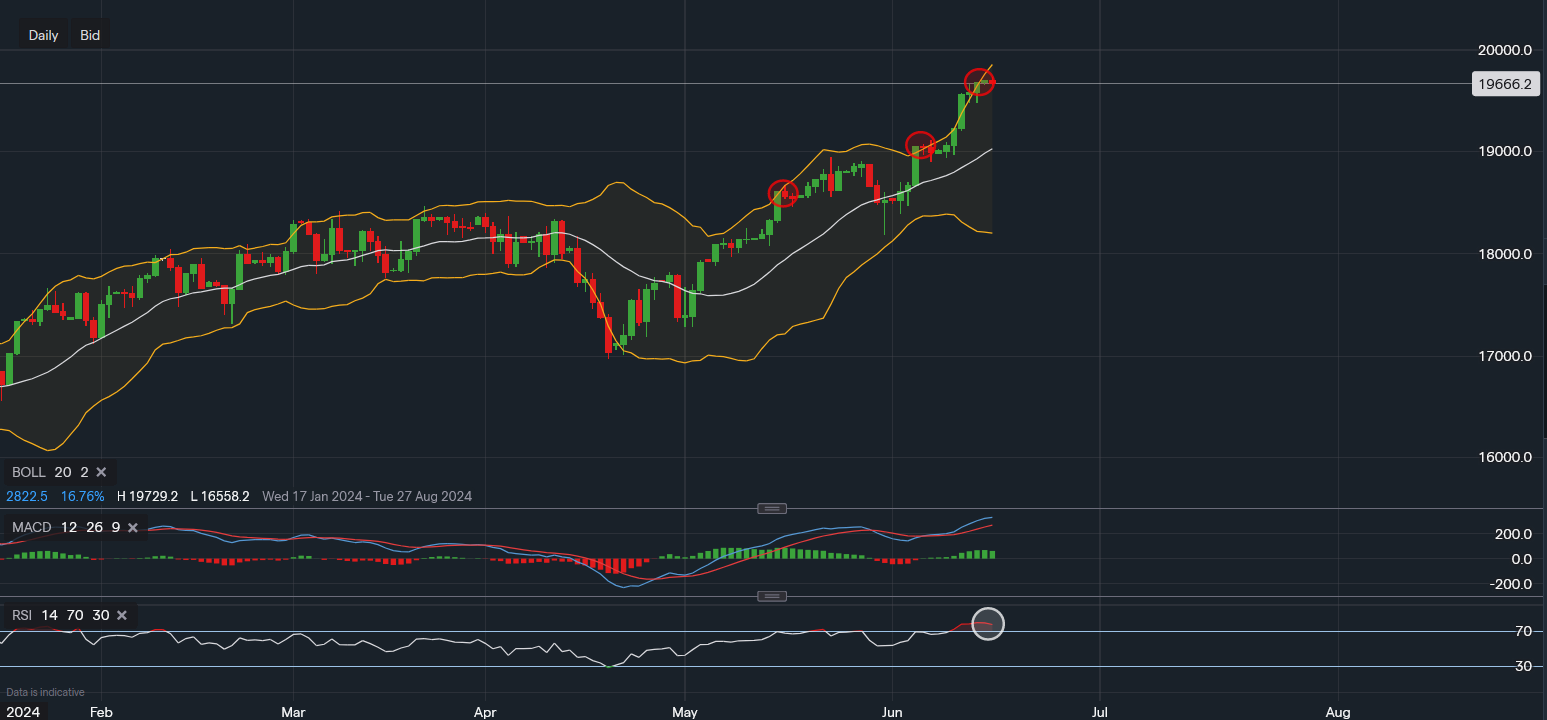
Chart & Data from IG
Taking a look at the Nasdaq after it hit fresh all-time highs last Friday. Currently, the tech-weighted index is trading at around 19,666 and it is looking a little overbought on the daily timeframe. Applying the Bollinger Bands to the chart, we can see it sitting in the upper Bollinger Band and when it has done so in the past, minor profit-taking has occurred. This is not an indication to go short as the index is arguably in a longer-term bull market, however, small rounds of losses can occur to support a healthy market. Hence, we may see a slight pullback or some sideway movement allowing consolidation to take place, especially going into the retail data tomorrow and beyond. The near-term support reads 19,477 and only a break below this level would indicate that further downside may be likely. Towards the upside, the new resistance is around 19,700. A break above this level would open the possibility of an extension towards 20,000. Even though the technical indicators are positive with the MACD grading suggesting further upside, the RSI is now at the highest level its been since January. Increasing the odds of a minor breather.

Tradable assets:
Min.Deposit:
Max Leverage:
FCA:

Rating:


