Test- FTSE 100 Kicks Off August on a High as BP and Senior Lead Market Momentum
$11
10 Oct 2025, 13:13
Neutral
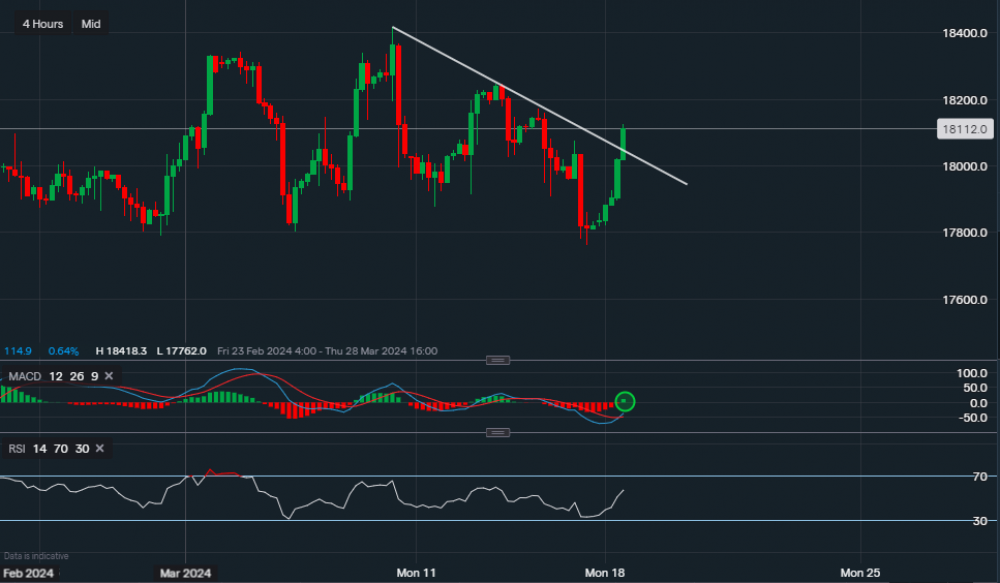
Chart & Data from IG
Taking a look at the Nasdaq 100 as we may be experiencing a breakout towards the upside on the 4-hourly timeframe. Currently, the index is trading at around 18,112 after experiencing the last two weeks in decline mode. Based on the 4-hourly chart, support around the level of 18,400 seems to be acting as the base for now. A break below this support level would entice the bears to increase the selling pressure towards 17,400. Towards the upside, resistance was around 18,042 but this level has now been broken. However, the candlestick is yet to close, a close above would suggest bullish momentum is present. Following a close, the next level of resistance for the bulls sits at 18,173 followed by 18,245. A break above 18,245 would create room for a push towards all-time highs once again. However, with the FOMC looming and due on Wednesday, it is possible that the index will undergo some sideways movement until the data is released. Looking at the technical indicators, the MACD has turned positive and so has the RSI as it reads 56.

Tradable assets:
Min.Deposit:
Max Leverage:
FCA:

Rating:


