Test- FTSE 100 Kicks Off August on a High as BP and Senior Lead Market Momentum
$11
10 Oct 2025, 13:13
Neutral
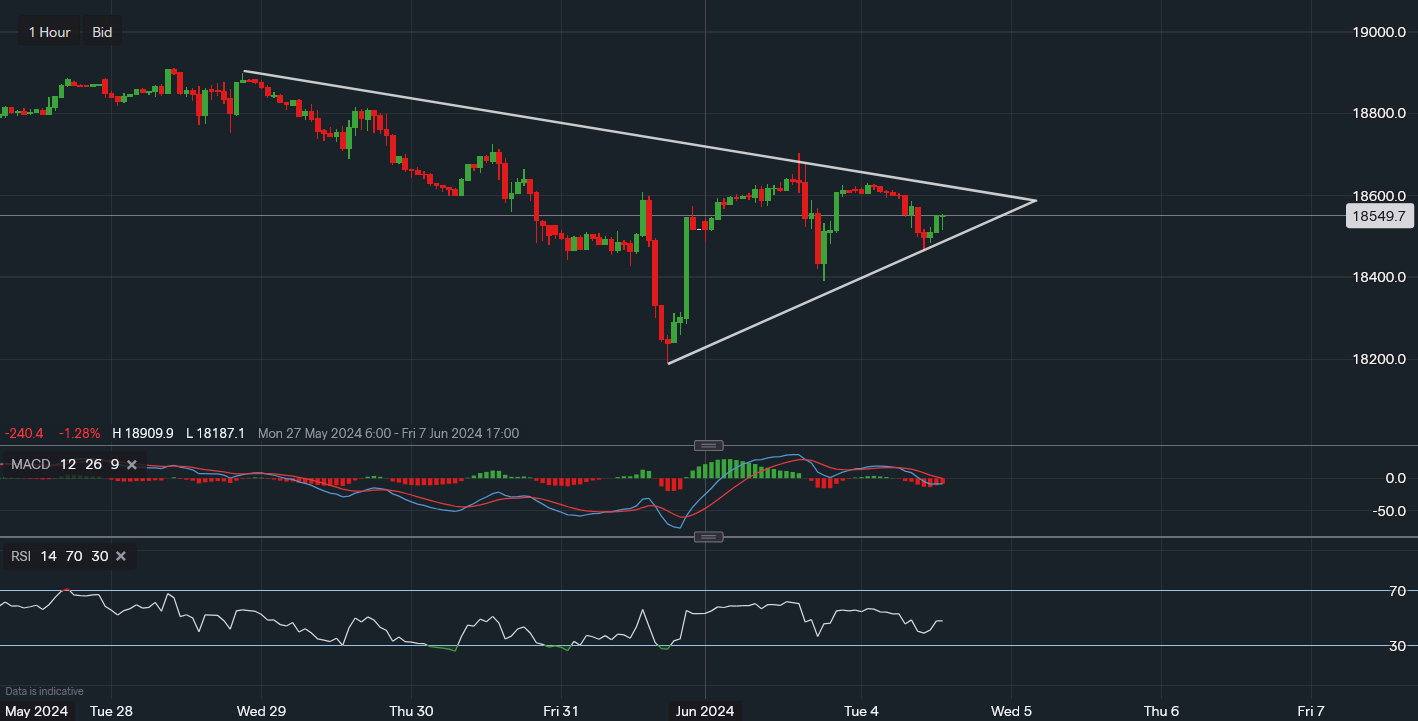
Chart & Data from IG
Nasdaq 100 trading at around 18,549 here in the pre-market trade. We can see that on the 1-hourly chart a squeeze is occurring, with support and resistance narrowing, an explosive move in either direction could be likely in the US session. Support along the ascending trendline reading 18,488 and resistance along the descending trendline reading 18,616. A break below 18,488 would have the bears eyeing 18,389, whereas a move above 18,616 would have the bulls eyeing 18,704 and then 18,724. As the index is trading in a tight range and this is a 1-hour chart view, the technical indicators are mixed heading into the US session. The MACD is negative but has now flattened and the RSI is neutral as it reads 49.

Tradable assets:
Min.Deposit:
Max Leverage:
FCA:

Rating:


