Test- FTSE 100 Kicks Off August on a High as BP and Senior Lead Market Momentum
$11
10 Oct 2025, 13:13
Neutral
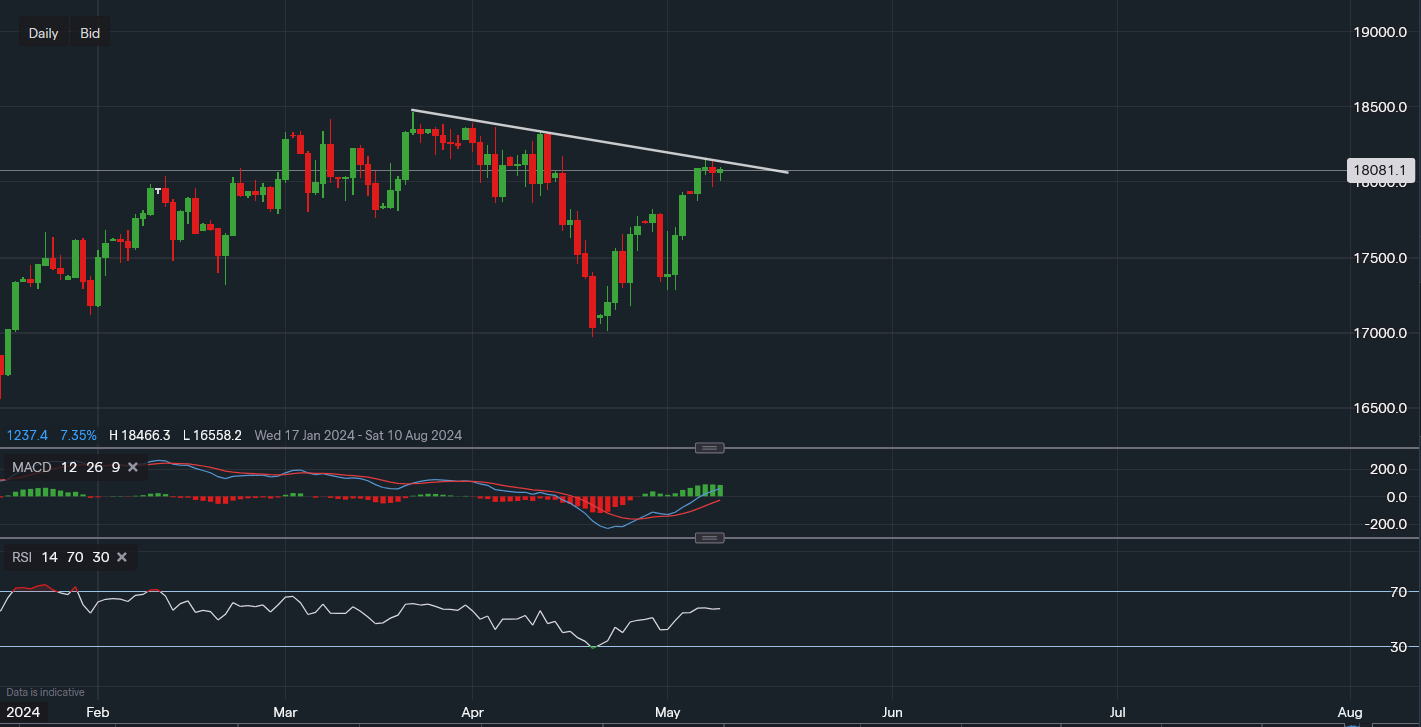
Chart & Data from IG
The NASDAQ100 has now approached a resistance point here on the daily chart, following the recent rally which stemmed from a slightly dovish Jerome Powell and strong big tech earnings. As well as the ‘buy the dip’ strategy from investors and traders. Currently, the tech-weighted index is trading at around 18,081. We can see that the resistance sits along the trendline reading 18,102. A break and close above it in today’s sessions could see the week finish in the green for the third consecutive week. The current trendline resistance would then flip to near-term support for the index. Following a successful breakout, the next resistance targets would then be 18,337 and then the all-time high of 18,466. Towards the downside, the support reads 17,966, which is yesterday’s low. A break below it could take us to 17,875 and then potentially to 17,800. Looking at the technical indicators, they are looking rather bullish. The MACD is positive and rising and the RSI is also positive as it reads 58.

Tradable assets:
Min.Deposit:
Max Leverage:
FCA:

Rating:


