Test- FTSE 100 Kicks Off August on a High as BP and Senior Lead Market Momentum
$11
10 Oct 2025, 13:13
Neutral
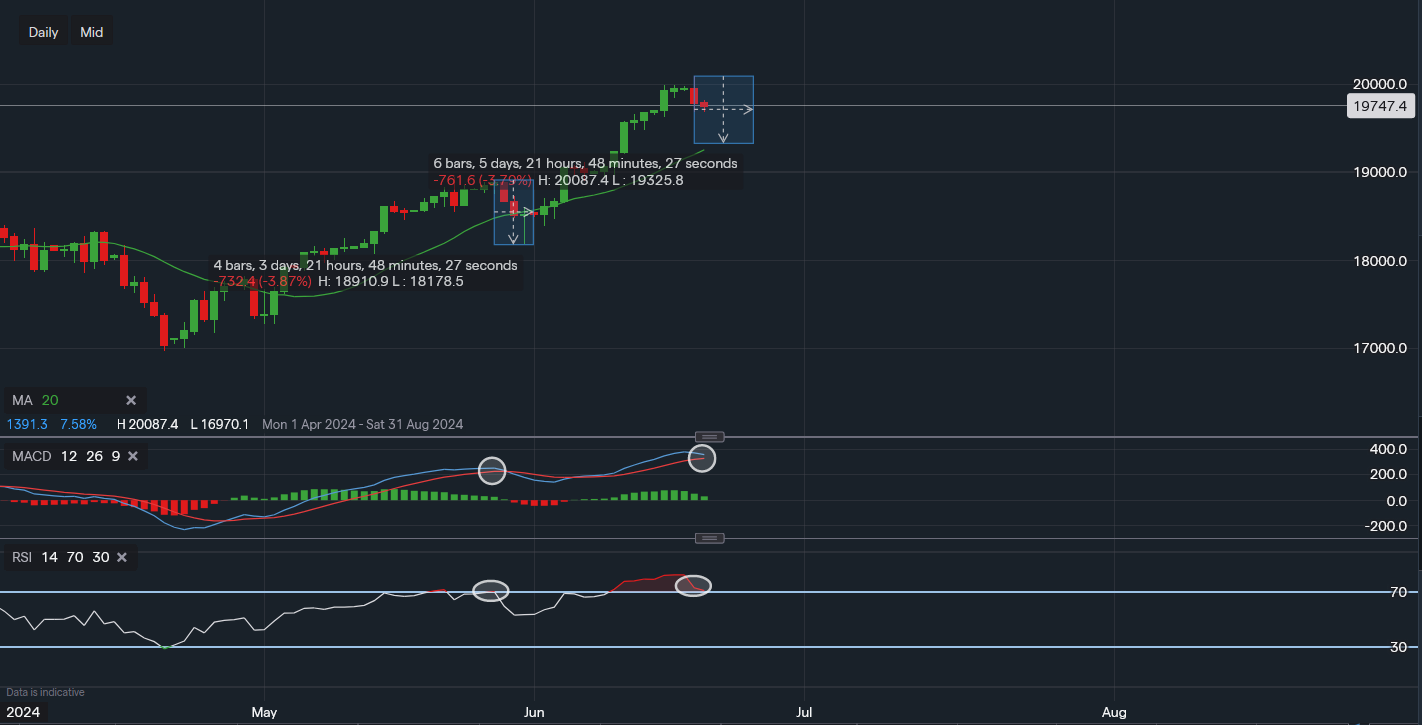
Chart & Data from IG
Taking a brief look at the Nasdaq100 as it may be taking a breather here from its more than impressive rally. Currently, the tech-heavy index is trading at around 19,747 in the pre-market trade and flat so far on the day. After 8 straight days in the green, some profit-taking seems to be finally taking place. Looking at this uptrend and its previous habits, we can see that maybe a healthy pullback of 3-4% could be underway to create a balance within the market. We can see on the daily chart that after the rally in May, the index pulled back approximately 3.8% to consolidate around its 20-day moving average. It wouldn’t be a surprise if a similar move was to repeat itself here going into the backend of June. History shows that seasonality for July tends to be strong, hence, a small correction followed by another bump higher could be on the cards. This bias can be supported by looking at the technical indicators, both the MACD and RSI are looking overbought, The RSI remains in an overbought condition as it reads 71 and the MACD line is starting to curve lower. Both indicators were in a similar stance back in May. The support in the near term is the level of 19,622. A break below would then shift the focus to 19,478 and then the 20MA, which currently reads 19,253. However, depending on the volatility and liquidity in the coming sessions, the 20MA is more likely to rise to the range of 19,300-19,400.

Tradable assets:
Min.Deposit:
Max Leverage:
FCA:

Rating:


