Test- FTSE 100 Kicks Off August on a High as BP and Senior Lead Market Momentum
$11
10 Oct 2025, 13:13
Neutral
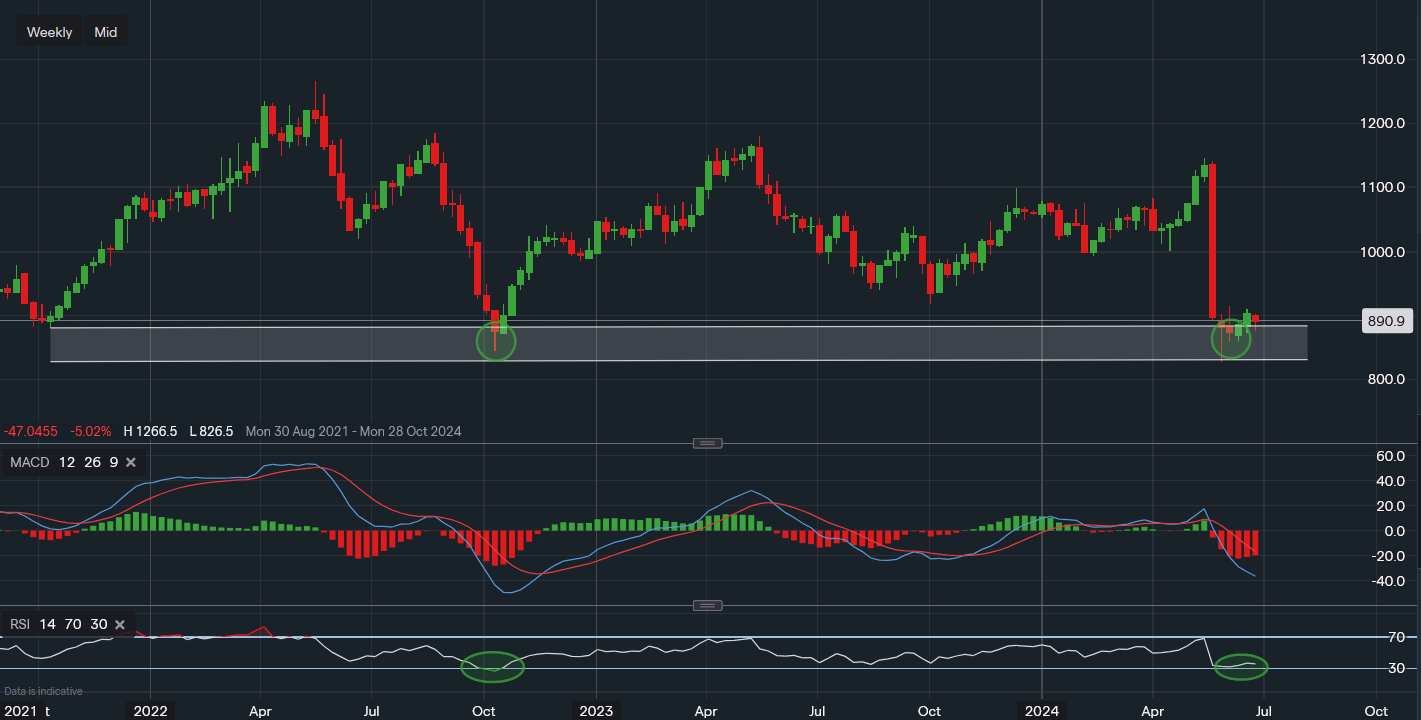
Chart & Data from IG
National Grid is at an interesting level here relative to the history of the chart. Based on the weekly interval, the price has just entered a key support area which dates back to October 2021. The support area is in a range of 880p and now 826p after a new low was created on the week that commenced 27th May. We can see that at the low of 826p the buyers have rushed with the dip being bought up and the price closing higher around 885p. The support of 880p is once again the support in focus here for the short term. A break below it would then have support at 859p and the new low of 826p. However, looking at October of 2022, when the price of NG fell to similar levels, the buyers stepped in. This saw the stock rally 34% across a 7-month period. The past is not a guarantee of the future but can be used as a guide. A move above 914p, which is the near-term resistance, may spark some optimism allowing investors to re-analyse. The technical indicators are now aligning similarly to that of October 2022, the MACD still looks like it could grind lower but if the price can consolidate within the highlighted area then this would be a good start for investors. The RSI did fall towards 32 but has now inched higher to 35 as some buying has occurred. One to watch over the next few weeks.

Tradable assets:
Min.Deposit:
Max Leverage:
FCA:

Rating:


