Test- FTSE 100 Kicks Off August on a High as BP and Senior Lead Market Momentum
$11
10 Oct 2025, 13:13
Neutral
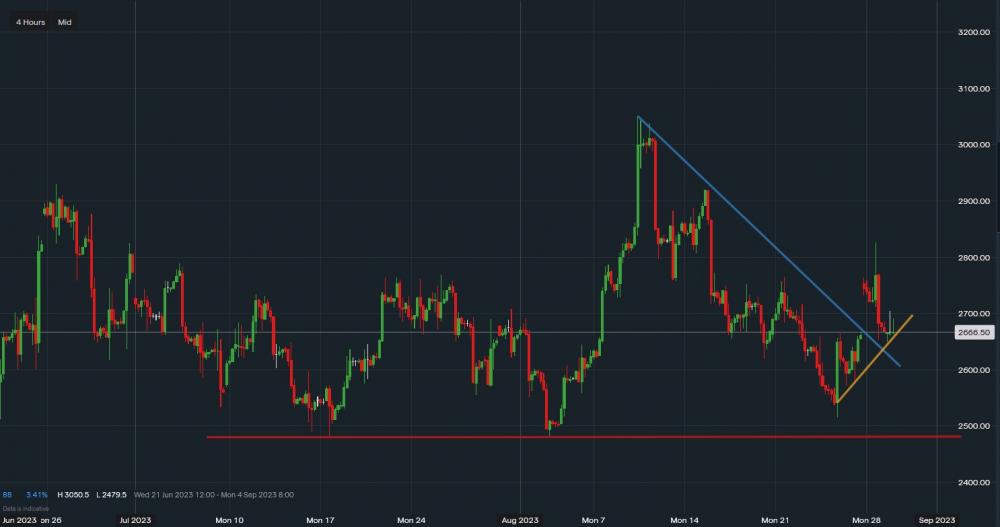
Natural gas - Chart & Data from IG
Natural Gas gapped higher on Monday but has since filled the gap into what was resistance, now turned support. While doing so, natural gas has also formed a minor upside support trendline. A break below the yellow line will likely indicate further consolidation in the commodity. It's not until a break of the blue downtrend support would that indicate a more negative outlook. A further break of that line could see gas test the $2.500 lows. A break below here could then see natural gas aim towards $2.100 - Winter temperatures in the EU & USA be a huge driving factor to a further drop though. Towards the upside, if support of the yellow line can hold then a move towards $2.800 could be on the cards. With further upside targetting $2.900 and then $3.000 and $3.047.

Tradable assets:
Min.Deposit:
Max Leverage:
FCA:

Rating:


