Test- FTSE 100 Kicks Off August on a High as BP and Senior Lead Market Momentum
$11
10 Oct 2025, 13:13

Chart & Data from IG

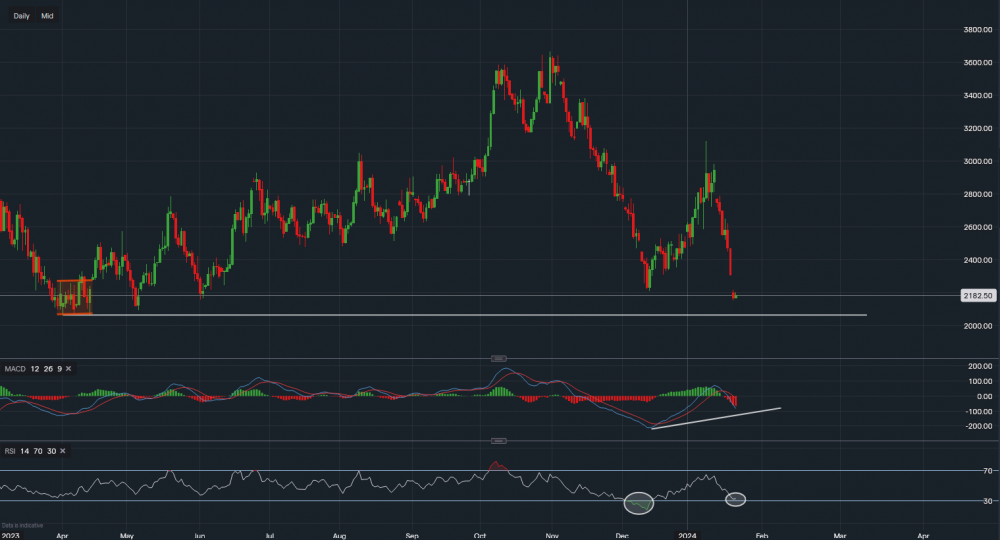
Natural Gas opened 5.5% lower today, continuing its decline from the previous week. Currently, it's trading at around $2.182. Looking at the history of the chart from a daily perspective, we can see that once again the price has approached the lows of 2023. The initial support here is now Sunday’s low of $2.153 followed by $2.093 (left of the chart). A move below $2.093 could then see NG test the key support of $2.064 (white trendline – also acting as a base). However, if we look at the RSI indicator, we can see that it’s almost suggesting that the market is a little oversold. Hence, if it does enter the oversold territory, a short-term bounce may follow. Looking back to April of 2023, we can see NG went through several days of consolidation (orange channel) before any upside movement, which enhances the likelihood of a similar scenario here. It is still too early to tell, but the MACD indicator could be forming a divergence as well, regardless of the bearish momentum that is currently underway. The price is forming a lower low, but so far, the indicator is forming what could be a higher high (ascending trendline on MACD). Upon signs of consolidation and history, the odds for a potential move back up to $2.350-$2.400 would increase.