Test- FTSE 100 Kicks Off August on a High as BP and Senior Lead Market Momentum
$11
10 Oct 2025, 13:13
Neutral
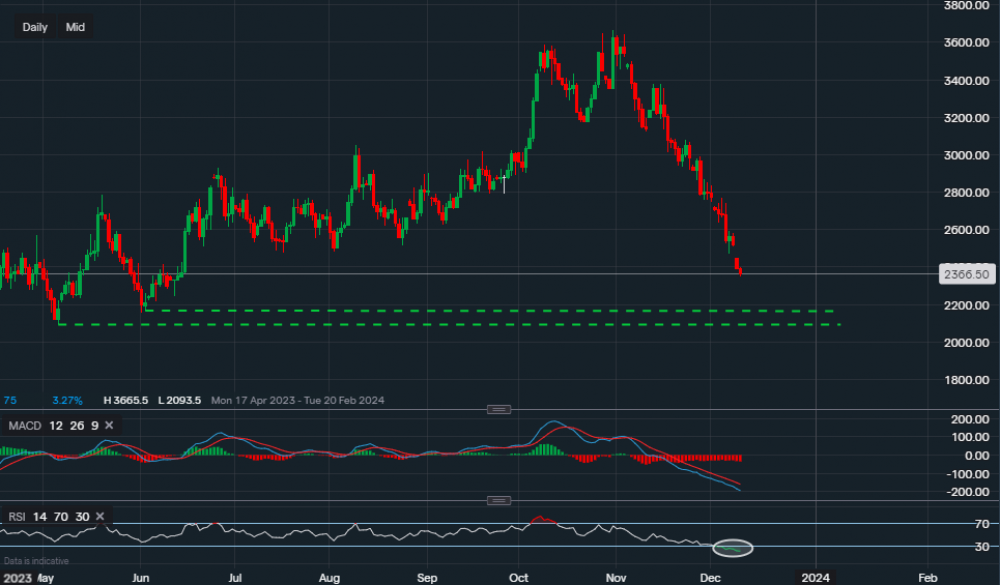
Chart & Data from IG
Taking a look at Natural Gas as the commodity has fallen off a cliff in November, erasing all the gains between June and September. Currently, the commodity is trading at around $2.366. We can see that it is now approaching a key support area, which is highlighted by the green trendlines. This support zone reads $2.093-$2.158. If the price reaches this area and is meant to move lower, then this will not be a sharp decline as it will first undergo a test. If we do see a break below the support of $2.093 then $2.064 is the final straw. A move below $2.064 could result in levels not seen since July 2020. The bias is heavily bearish right now, so it would be unreliable to look towards any resistance levels. However, if there are signs of consolidation either around current levels or the support area, then the risk to reward for the bulls would become more attractive. Further analysis would then be provided. If we look at the technical indicators, we can see that they are both heavily negative. The MACD is at a level last seen in February and the RSI indicates major oversold conditions. The RSI could be the catalyst if any consolidation was to occur.

Tradable assets:
Min.Deposit:
Max Leverage:
FCA:

Rating:


