Test- FTSE 100 Kicks Off August on a High as BP and Senior Lead Market Momentum
$11
10 Oct 2025, 13:13
Neutral
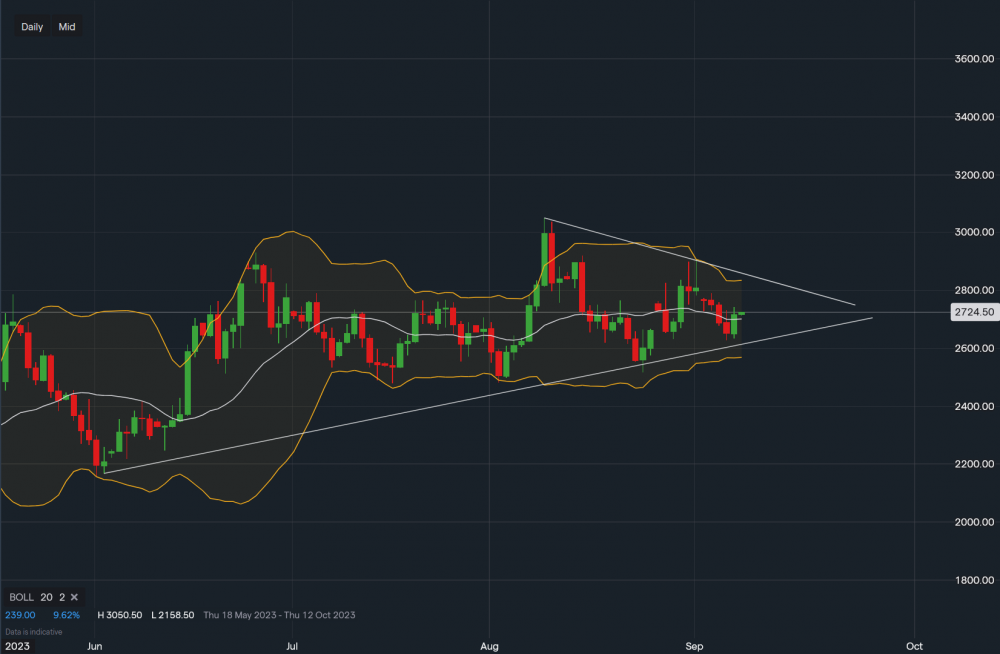
Image Data IG
Natural gas had a strong day on Thursday and has now moved into the upper Bollinger Band. Support for the commodity sits at $2.642 weekly lows with a break below here targetting $2.510. A drop to this level would suggest a break towards the downside in the symmetrical triangle pattern. However, gas would still be within its yearly range.
Towards the upside, resistance for Natural gas sits at $2.834 with a break above here aiming towards $2.907. A break above here would indicate a move out of the triangle pattern towards the upside, a further sustained move could then target $3.050. RSI is currently neutral with MACD trending slightly lower.

Tradable assets:
Min.Deposit:
Max Leverage:
FCA:

Rating:


