Test- FTSE 100 Kicks Off August on a High as BP and Senior Lead Market Momentum
$11
10 Oct 2025, 13:13
Neutral
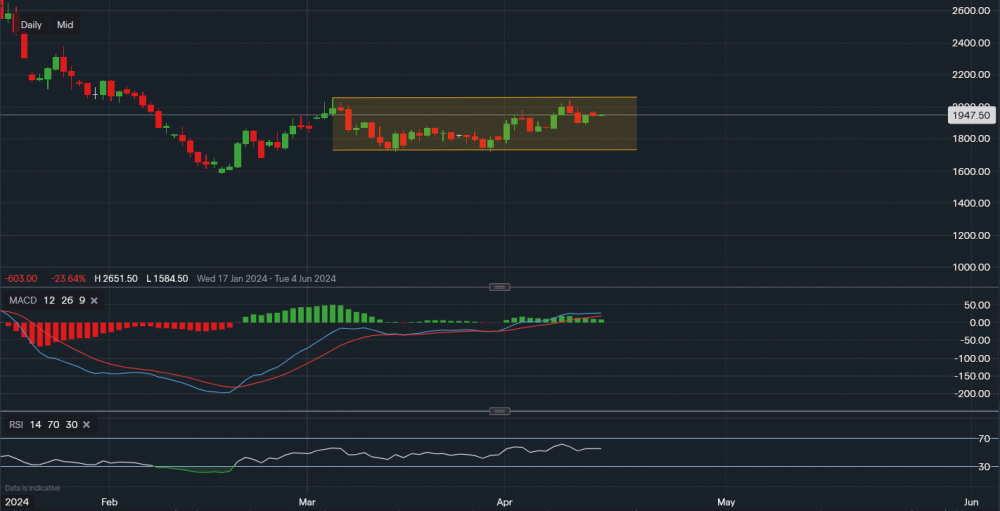
Chart & Data from IG
Natural gas trading within the channel drawn on the daily chart. Currently, trading at around $1.947 a ton with clear price resistance at $2.058, which is this year’s high. The commodity tried overcoming this resistance but the momentum faded, only reaching the level of $2.04 last week before pulling back. However, it seems like there now is some support at $1.884 for the near-term. Perhaps this will be enough for the bulls to test the resistance above. A move and close past the level of $2.058 would then allow the bulls to target the area of $2.168-$2.200. On the other hand, the failure to uphold the support of $1.884 would then shift the focus to $1.841. A break below $1.841 may lead to a pullback towards the low trendline of the channel, or respectively, $1.721. Looking at the technical indicators, the MACD is positive but volume how now somewhat lowered and the RSI is just positive as it reads 55.

Tradable assets:
Min.Deposit:
Max Leverage:
FCA:

Rating:


