Test- FTSE 100 Kicks Off August on a High as BP and Senior Lead Market Momentum
$11
10 Oct 2025, 13:13
Neutral
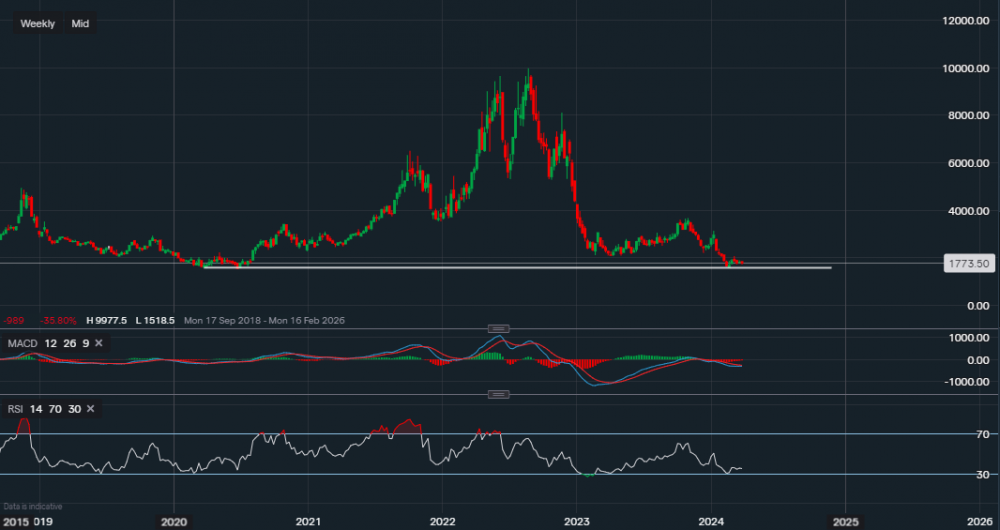
Chart & Data from IG
Natural Gas has bounced off the key support base earlier in the year, falling as low as $1.584 but now trading at around $1.173. We can see on the weekly chart that the commodity is trying to consolidate around current levels for further support, however, it is clear that selling pressure persists. A fall below this support base could see this selling pressure rise, forcing the price lower towards $1.000. The resistance now reads $1.879 followed by March’s high of $2.058. A break and close above $2.058 may lead to a new trend in the short-mid term. Looking at the technical indicators, the MACD seems like it may be starting to flatline with the volume now much lower than before. The RSI is negative but it’s very similar to the MACD, perhaps this is the start of a new consolidation phase.

Tradable assets:
Min.Deposit:
Max Leverage:
FCA:

Rating:


