Test- FTSE 100 Kicks Off August on a High as BP and Senior Lead Market Momentum
$11
10 Oct 2025, 13:13
Neutral
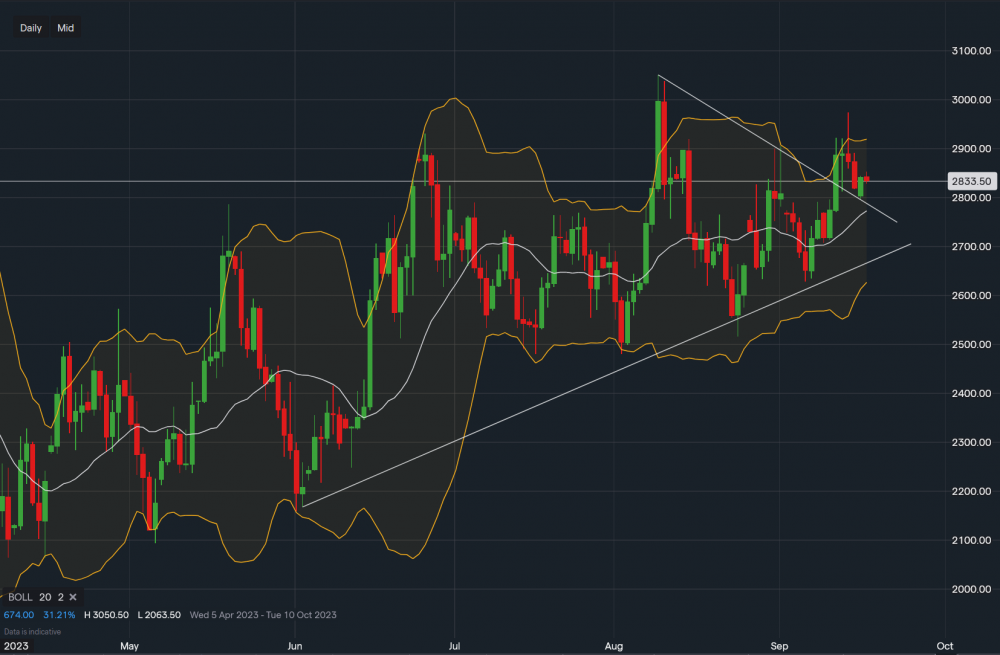
Image Data IG
Natural gas has recently broken out to the upside and continues to hold trendline support. As winter fast approaches, energy looks to be moving to the upside with oil recently rising past the $90 level. In turn, the bullish sentiment could push Natural gas higher into the 2023 winter. Looking at the chart, support for the commodity sits at $2.800 with a break here then pushing gas back into the triangle pattern. Further support sits at $2.671 and then the Bollinger lows of $2.626. Towards the upside tough resistance sits at $2.973 (september high) followed by $3.000 and then $3.050. A break above here could then take gas way higher towards the $4-$5 region. Much of the price will have to do with demand and weather conditions as the world heads into November and December. Russia will also look to sustain the way in Ukraine which will also keep prices elevated too.

Tradable assets:
Min.Deposit:
Max Leverage:
FCA:

Rating:


