Test- FTSE 100 Kicks Off August on a High as BP and Senior Lead Market Momentum
$11
10 Oct 2025, 13:13
Neutral
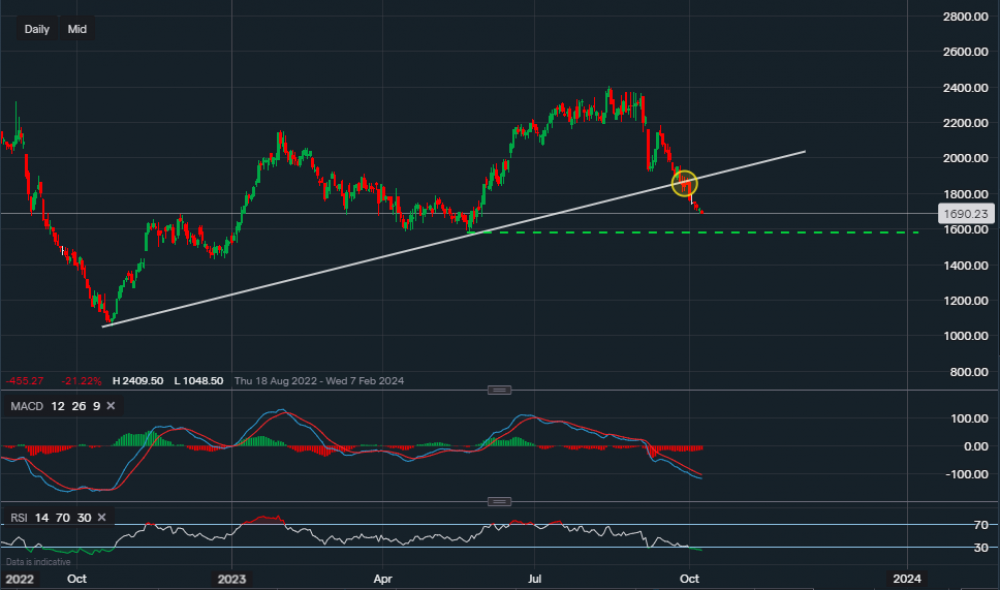
Chart & Data from IG
Neogen is due to report quarterly tomorrow, the company is expected to report an EPS of $0.05 on revenue of $231.61m. Currently, its stock is trading at around $16.90 a share. If we look at the chart from a technical aspect, we can see that the trendline support dating back to October of last year has now been broken. The yellow oval highlights this. However, this does not necessarily suggest that a new long-term bearish trend has begun. Marked by the green trendline, the next key support level is still in place at $16.04, a break below this point would then indicate that further moves lower are possible. It would be unreliable to analyse any resistance zones as the price seems like it may continue falling until the earnings release. If the outcome of the earnings report leads to consolidation around the current levels or the green trendline support, we would then take a look at the resistance above. Heading over to the technical indicators, the MACD is still negative and so is the RSI as it reads 24. However, the RSI does suggest that the stock is currently oversold, but this does not guarantee a bounce in the opposite direction.

Tradable assets:
Min.Deposit:
Max Leverage:
FCA:

Rating:


