Test- FTSE 100 Kicks Off August on a High as BP and Senior Lead Market Momentum
$11
10 Oct 2025, 13:13
Neutral
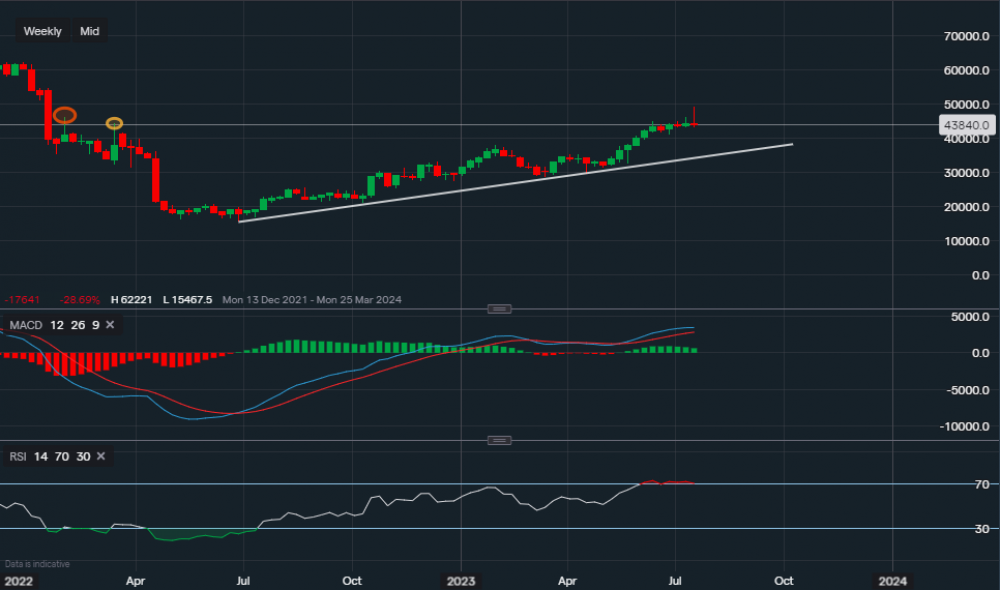
Chart & Data from IG
Taking a look at Netflix after the streaming giant kicked off the tech earnings season. Currently, its shares sit at around $438.40 a share. Even though the company reported a better-than-expected EPS, it missed their expectation regarding its revenue. This has now been back to back with the previous quarter and also similar to this time last year when it was also missed. Netflix is showing growth though, still managing to increase its revenue but just not with expectations. The earnings Q2 came in at $3.29 per share on revenue of $8.19bn. From a technical perspective, we can see that its share price attempted to break through the resistance point of $443.34 (yellow oval) and even $463.39 (orange oval) but struggled to close above it. Pretty much forms a shooting star doji on the weekly timeframe, suggesting we now may see some sort of retracement after the strong bullish trend over the last couple of months. Support below sits at $430.83 then at $411.52, a break and close below $411.52 may see the price slide lower towards the range of $390-$400 a share. Over to the technical indicators, MACD is still positive and so is the RSI as it reads 70, although the RSI is suggesting that the stock is currently slightly overbought. Another indication of a potential retracement. But depending on how the remainder of the big tech stocks perform, could hold the price of Netflix around current levels.


