Test- FTSE 100 Kicks Off August on a High as BP and Senior Lead Market Momentum
$11
10 Oct 2025, 13:13
Neutral
New Relic Inc - Chart & Data from IG
Overview
New Relic is a technology company which develops cloud-based software to help website and application owners track the performance of their services. The company headquarters is based in San Francisco, California.
Financials
Comparing the financial year ending 31st of March 2022 versus 2021. Total revenue rose by $118 million with gross profit rising by $43 million. However, after all operating expenses the total operating income totalled $-228.5 million, a $57 million increase YoY. EBITDA came in at $-140 million, almost an $80 million increase than in the previous year with EPS being reported at $-3.88 a share. Total liabilities rose by $120 million lowering shareholder equity as total assets only rose by $29 million, which is partly due to the fact that the company saw a rise in long-term debt by $48 million. Additionally, its cash-on-hand pile increases YoY are lowering since 2019. As a result of the above, shareholder equity was reported at $322 million which is $91 million less in the prior year.
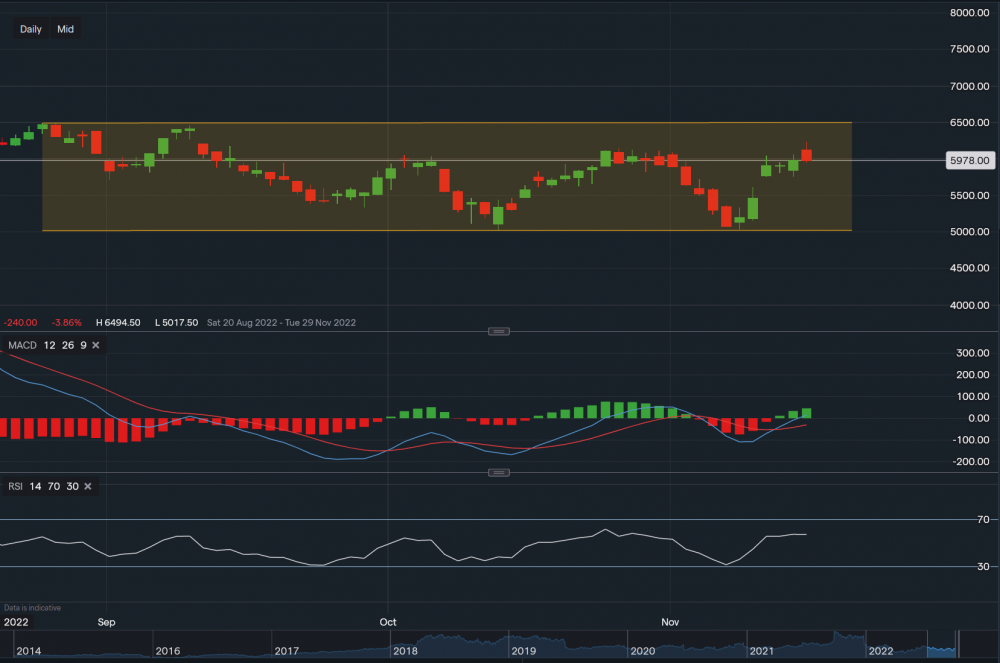
Technicals
From a technical outlook, its share price is currently sat at $59.78 a share. Towards the upside, resistance sits at $60.39 then at $61.40 then at $61.73. A break above these resistance levels could see the stock climb towards the major resistance level at $64.90, which corresponds with the upper trendline of the channel. Towards the downside, support sits at $58.76 then at $57.71 then at $56.51. A break below these support levels may see the share price fall towards the $54-$55 price range. Looking at the indicators, MACD is positive and so is RSI as it reads 57.
Summary
Even though the stock’s share price is trading about $18 higher than back in May 2022, and the technical indicators are suggesting more upside, the financials of the company are quite poor. It continues to show increases in revenue and gross profit YoY, however after all expenses, the net income actually comes in at loss and the loss increases YoY as well. Furthermore, EBITDA and EPS demonstrate a gradual decline year-on-year and the jumps in liabilities outweigh any increases in assets. As a result, shareholder equity has fallen. Unless the company begins to create any improvements in the next 3-5 years among its business operations to become profitable, this stock is a high risk at this moment in time.

Tradable assets:
Min.Deposit:
Max Leverage:
FCA:

Rating:


