Test- FTSE 100 Kicks Off August on a High as BP and Senior Lead Market Momentum
$11
10 Oct 2025, 13:13
Neutral
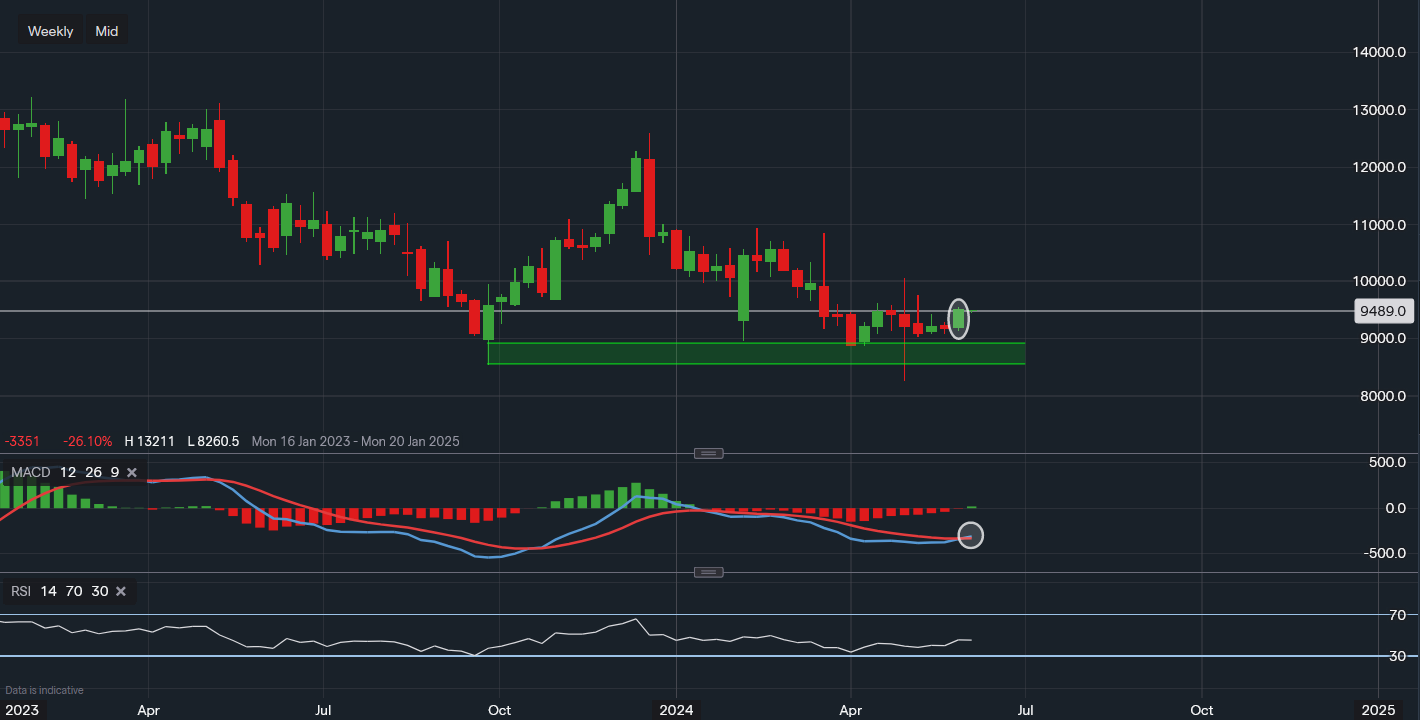
Chart & Data from IG
Taking a look at Nike as it looks like it may be ready for a pop higher here on the weekly chart. Currently, the stock is trading at around $94.89 a share. Last week the candlestick finished the week higher, it can be argued that it is engulfing compared to the previous week's candle. The base support here is outlined by the green channel, with the support base ranging between $88.78 and $85.34. A break below this base would certainly be a bearish indication and may see a significant sell-off for Nike. Towards the upside, the resistance in focus is now the level of $97.58 followed by $100.64. A move and close above the $100 mark could pave the way towards $108-$110 in the short-mid term outlook. Looking at the technical indicators, the MACD is seen to be turning positive after last week and the RSI has now crept into the neutral ground as it reads 45. Wall Street’s average consensus for Nike is $111.50 a share over the next 12 months.

Tradable assets:
Min.Deposit:
Max Leverage:
FCA:

Rating:


