Test- FTSE 100 Kicks Off August on a High as BP and Senior Lead Market Momentum
$11
10 Oct 2025, 13:13
Neutral
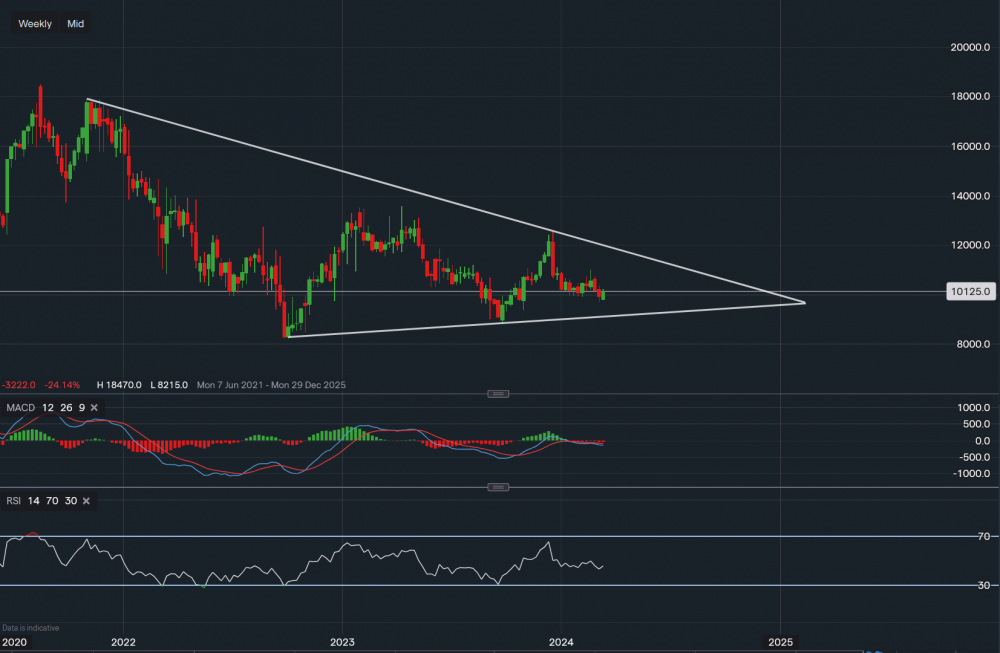
Chart & Data from IG
Taking a look at Nike on the weekly chart as the sports fashion retailer is back at 2020 levels. Currently, its stock is trading at around $101.25 a share. Nike’s shares are down 43% from their all-time highs and down 7% YTD. The chart does not offer much incentive for investors from a technical perspective, in our opinion, it seems like the buying and selling pressure is rather even. Making it difficult for the stock to choose a course of direction, as a result, we are witnessing sideways price movement. With the triangle drawn on the chart, we may see a sideways continuation before a squeeze occurs, forcing the price in either direction. It is worth noting that Nike is expected to report its earnings later on in the month, this could be the determent for any volatility in the short-term. The longer-term outlook at this moment in time is still unclear, therefore, the earnings call will offer more insights for the upcoming months when the company reports on its future guidance and the demand for its products. Regarding the technical analysis, resistance reads $110.05 and then $115.50-$116 (located along the upper trendline). A break of this resistance would then shift the focus towards $124-$125. Towards the downside, support levels on the watch are $97.05 then $92.85 and along the lower trendline reading $91.50. However, the bears would need to break below $88.04 for any further downside. Looking at the indicators, they are swaying more towards the bearish bias. The MACD is slightly negative and the RSI has just turned negative after the last couple of weeks of selling as it reads 44.

Tradable assets:
Min.Deposit:
Max Leverage:
FCA:

Rating:


