Test- FTSE 100 Kicks Off August on a High as BP and Senior Lead Market Momentum
$11
10 Oct 2025, 13:13
Neutral
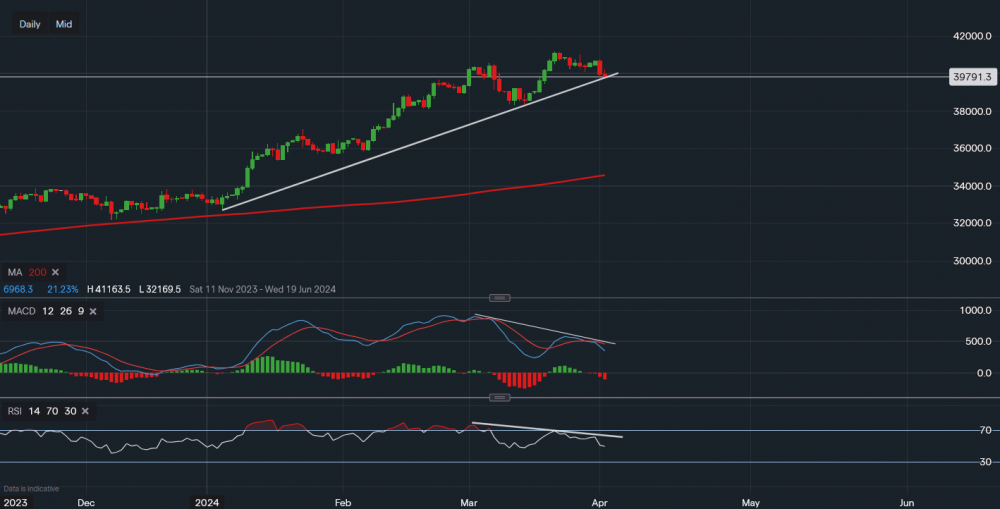
Chart & Data from IG
The Nikkei 225 has approached a key level here on the daily chart. Currently, the Japanese index is trading at around 39,791. We can see the index is now practically flirting with the support along the supportive trendline, the area in focus is highlighted by the red oval. The support level reads 39,736, a break and close below this level could lead to a further decline towards the support of 38,300, which was established in March. Signs of a potential pullback for the index are increasing, looking deeper into the chart, we can see that the technical indicators are suggesting a potential bearish divergence. This is highlighted by the descending trendline on the MACD indicator. A bearish divergence is when the price of a market creates higher highs but the indicators of that market form lower lows, indicating that a stall in momentum may be upcoming. However, this is not always guaranteed and may not be the case here. Therefore, if a bounce of the supportive trendline occurs, then the resistance levels in focus for traders will be 40,574 then 41,013, and then the all-time high of 41,163. The near-term bias has shifted slightly towards the downside, the MACD has now turned negative and the RSI has fallen to 49.

Tradable assets:
Min.Deposit:
Max Leverage:
FCA:

Rating:


