Test- FTSE 100 Kicks Off August on a High as BP and Senior Lead Market Momentum
$11
10 Oct 2025, 13:13
Neutral
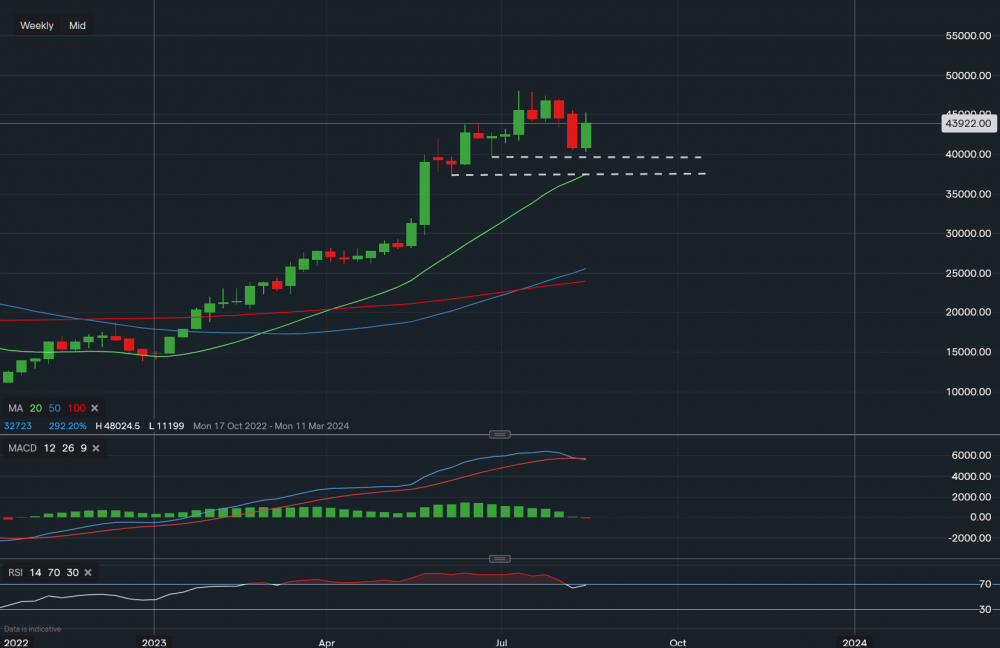
Chart & Data from IG
Nvidia’s stock is trading at around $439.22 a share. We can see clear signs of cooling after a strong rally from the start of the year, but it has bounced back this week. The current market sentiment has turned a little sour due to a more hawkish Fed and weakness in other global economies, so more downside cannot be ruled out. However, as many times before, certain stocks just simply outperform the market in times of crisis. So let’s take a look at the possible support and resistance zones. The first support level sits at $396.45 (upper dotted trendline) followed by $373.61 (lower). The gap between $396.45 and $372.61 is a key area where consolidation may take place, either before a move lower or a continuation of the bull trend. Another indication that highlights this area as key is if we look at the moving averages. There hasn’t been a pullback to the 20-day moving average since the 9th of January, this increases the likelihood of a move lower or consolidation which will allow the moving average to catch up. We will analyse further downside if a break below $372.61 occurred.
Looking at the upside, resistance sits at $439.89 and the price did move above it this week but has now retraced. A break and close above this level would only then allow us to look at higher levels. Based on the technical indicators, MACD has just turned negative, supporting the short-term downtrend. But the RSI is still positive it reads 68.

Tradable assets:
Min.Deposit:
Max Leverage:
FCA:

Rating:


