Test- FTSE 100 Kicks Off August on a High as BP and Senior Lead Market Momentum
$11
10 Oct 2025, 13:13
Neutral
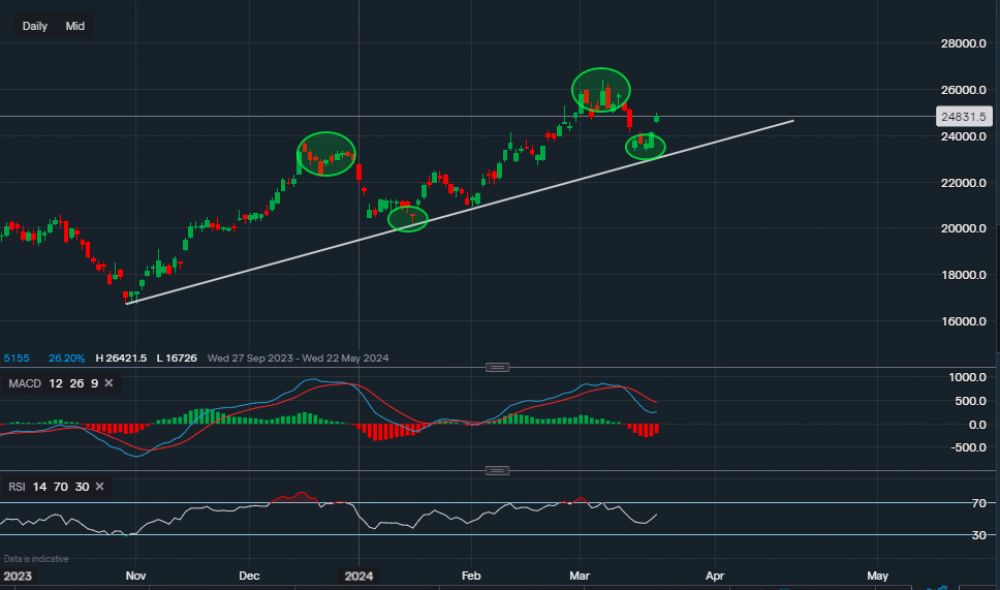
Chart & Data from IG
Taking a look at NXP as it recently has collaborated with Nvidia to Accelerate AI deployment with integration of TAO Toolkit with NXP Edge Devices. Currently, its shares are trading at around $248.31 a share and are up almost 3% on the day. Looking at the daily chart, we can see that a pattern of higher lows and higher lows is in play, with the most recent high at $264.21 (7th March). Since then, the price has pulled back towards the supportive trendline where potentially the new low has been formed. The higher lows and highs are highlighted by the green ovals. The resistance now sits at $252.79 then at $259.74 and then the all-high of $264.21. A break above $264.21 would then allow investors to eye up the area of $270-$280. Towards the downside, support now sits at $245.94 (today’s open). A move lower may see an attempt to close the gap below and head back towards the supportive trendline. Closure of the gap could see the share price slide into the area of $235-$240. Looking at the technical indicators, the MACD is negative but as we have seen in the past it's done that before where the price found support and then headed higher. Hence, the MACD should not be used alone for price determination as it is a lagging indicator. The RSI suggests a more optimistic view than the MACD as it reads 54 and is on the rise.

Tradable assets:
Min.Deposit:
Max Leverage:
FCA:

Rating:


