Test- FTSE 100 Kicks Off August on a High as BP and Senior Lead Market Momentum
$11
10 Oct 2025, 13:13
Neutral
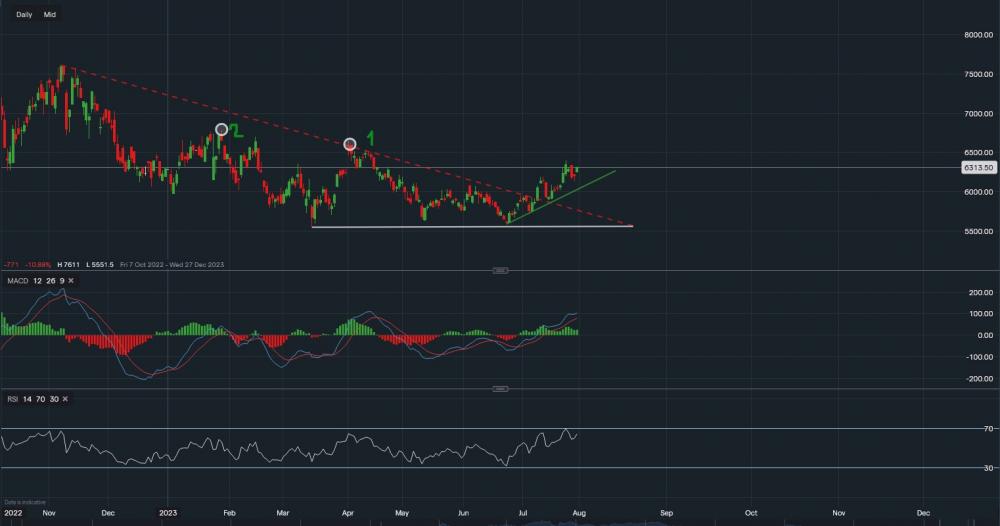
Chart & Data from IG
Taking a look at Occidental as the energy company is due to report quarterly earnings tomorrow. Currently, its stock is trading at around $63.13 a share, and we can see that the price is now comfortably in a bullish trend after breaking out of the descending triangle on July 11th. The support can be found along the green trendline with initial levels at $61.98 followed by $61.30 and then the key level at $60.61 (trendline). A break and close below the trendline may indicate a move lower towards $58.96, but given the current energy market, this would require some significant selloffs alongside extremely poor earnings. Resistance above sits at $63.96, a break above it could see the price head towards targets 1 & 2 of $66.46 and $67.92. These are highlighted by the white ovals on the chart. The bias for the time being is bullish and a positive report might provide the additional momentum for those levels to be reached. Not necessarily in a day or two, but 1-2 weeks. However, this is of course dependent on the earnings report. Looking at the technical indicators, MACD remains positive and so does the RSI as it reads 63.


