Test- FTSE 100 Kicks Off August on a High as BP and Senior Lead Market Momentum
$11
10 Oct 2025, 13:13
Neutral
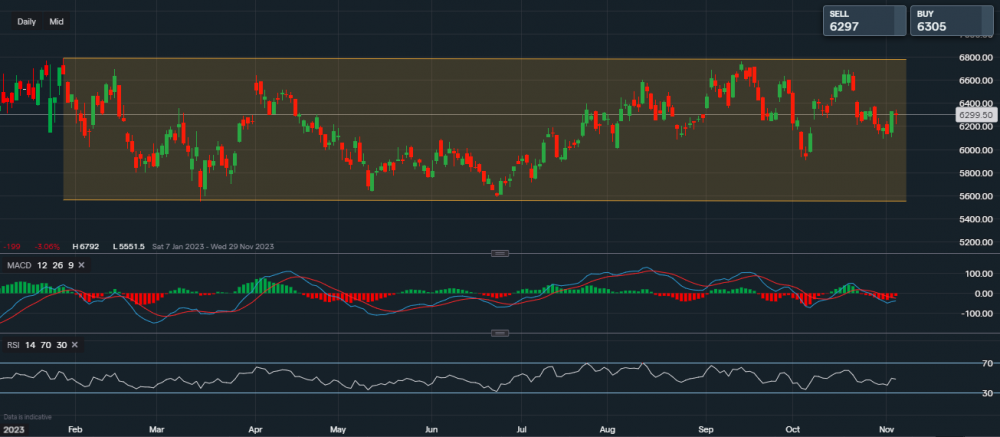
Chart & Data from IG
Occidental is the final major player in the oil industry to report its earnings tomorrow. Currently, its share price sits at $62.99 a share. Looking at the chart from a technical aspect, we can see its share price has been rather rangebound since the start of the year. We can see the price continues to trade within the channel drawn on the chart, or respectively, $55.50-$67.90. There have been a couple of attempts for a potential break towards the upside, with one in September and one in October, but resistance is proving its strength for the time being. The support base below seems robust as the price came close to testing it going back to both May and June, since then, the price of OXY has pretty much stayed above $58. The key resistance levels for bulls to focus on now sit at $63.77 then at $64.52 and then at $65.20. A break and close above $65.20 would then create the potential for a stretch once again towards $66-$67, the higher end of the channel. The support sits at $62.32 then at $61.38 and then at $60.93. A fall below $60.83 may see a slide lower towards the more important support of $59.10. The technical indicators are a little mixed ahead of the earnings report, as tends to be the case for many stocks. The MACD is slightly negative and the volume has lowered, whereas the RSI is neutral as it reads 48.

Tradable assets:
Min.Deposit:
Max Leverage:
FCA:

Rating:


