Test- FTSE 100 Kicks Off August on a High as BP and Senior Lead Market Momentum
$11
10 Oct 2025, 13:13
Neutral
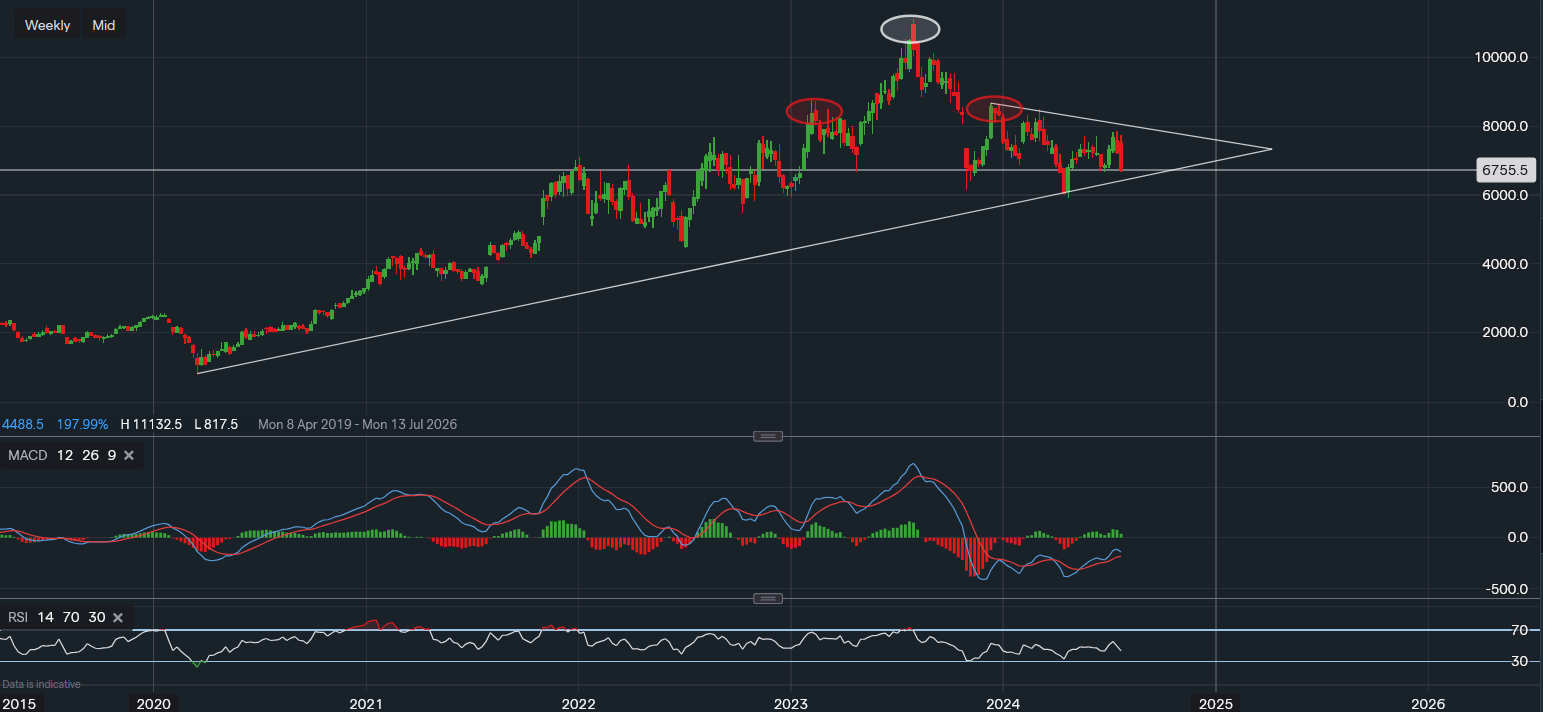
Chart & Data from IG
A head and shoulders formation on the weekly chart for ON which followed through with a move lower throughout March and April. The stock then found some support around $59.35 in line with the trendline dating back to Covid levels. The stock’s shares closed the session yesterday at $67.55 a share, following a sell-off after failing to move above the trendline resistance. The stock ran out of steam around $78.75, marking this as the resistance for the coming earnings/months. The price sits just above the support of $66.81, a move below here could see a slide back to trendline support ($64.39). A move below the trendline would not initially indicate that a deeper sell-off is underway unless a break below $59.25 occurs. With the earnings looming, the technical indicators are certainly flashing caution. The MACD is curbing lowering with the risk of turning negative now increasing, the RSI is also sliding lower and has turned negative as it reads 43.

Tradable assets:
Min.Deposit:
Max Leverage:
FCA:

Rating:


