Test- FTSE 100 Kicks Off August on a High as BP and Senior Lead Market Momentum
$11
10 Oct 2025, 13:13
Neutral
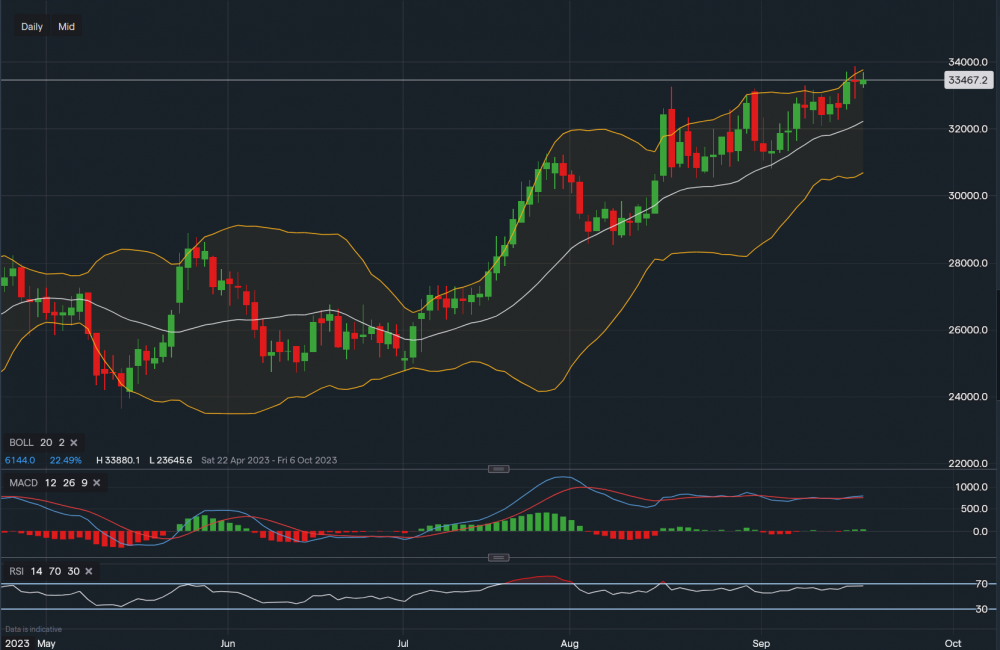
Chart & Data from IG
Orange Juice is currently trading at around $334.67, if we apply the Bollinger Bands to the chart on the daily interval, we can see the bullish momentum continues to uphold with the price remaining near the upper Bollinger Band. Some analysts predict that prices may reach another record high as hurricane risks linger. As the bias remains bullish, resistance sits at $338.80 (yesterday’s all-time high), a break above this level could see the price head higher towards $345-$350. Towards the downside, minor support sits at $328.95 (yesterday’s low) then at $325.74 and then at $322.19 (middle moving average of the Bollinger Band). A break below $322.19 would not necessarily mean that a reversal trend is occurring but simply that the market is taking a breather, with a potential move lower testing the support of $308.24. If we take a look at the indicators, we can see that perhaps now is the time for a short-term retracement as the MACD is flat and the RSI has faltered slightly but is still positive as it reads 64. However, this should not be taken as an interpretation to go short as the market may continue sideways before a clear indication of a move in either direction is visible.

Tradable assets:
Min.Deposit:
Max Leverage:
FCA:

Rating:


