Test- FTSE 100 Kicks Off August on a High as BP and Senior Lead Market Momentum
$11
10 Oct 2025, 13:13
Neutral
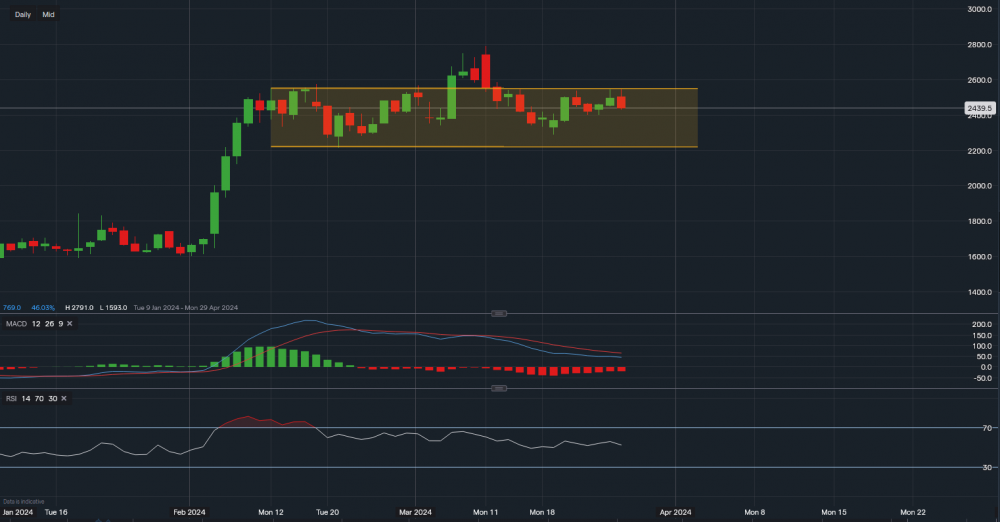
Chart & Data from IG
Potential head and shoulders formation here on the daily chart for Palantir. Currently, its stock is trading at around $24.39 a share. With what currently looks like a minor market correction may be underway, especially in the tech sector, selling pressure could increase here for PLTR. The resistance is clearly along the upper trendline of the channel, after experiencing a third rejection today over the last six days. The support for the near term sits at $24.00, a break below it could see the price decline towards the lower trendline of the channel. Where the support levels are $22.89 followed by trendline support of $22.14. If we were to see a turnaround, by that we mean a move above $25.51 (key resistance), then the attention would turn towards this year’s high of $27.91. Looking at the technical indicators, they do currently suggest that more downside may be underway but this isn’t guaranteed as they are lagging indicators. Nevertheless, the MACD is negative and sliding, whereas the RSI is neutral but faltering. Reads 52.

Tradable assets:
Min.Deposit:
Max Leverage:
FCA:

Rating:


