Test- FTSE 100 Kicks Off August on a High as BP and Senior Lead Market Momentum
$11
10 Oct 2025, 13:13
Neutral
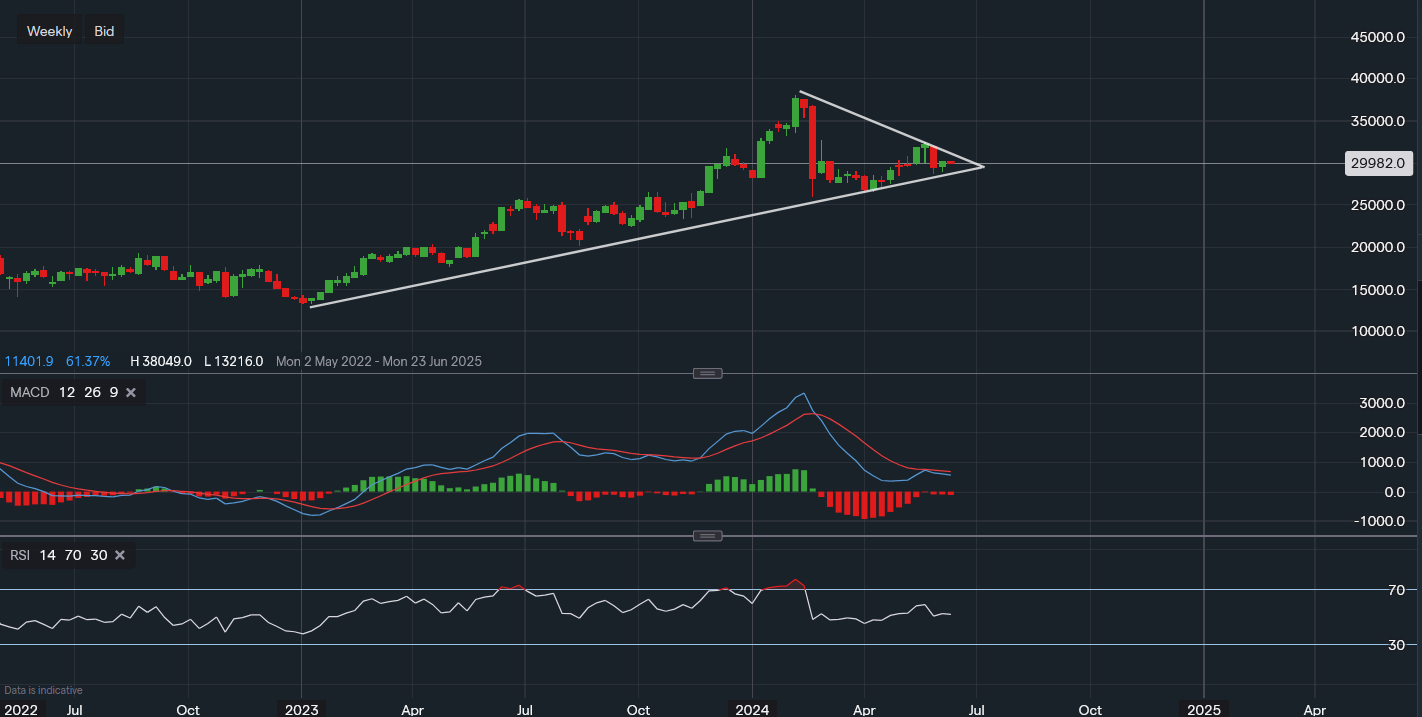
Chart & Data from IG
The weekly chart shows that the price of its stock has found itself within a tight area between support and resistance. The stock attempted to move higher in May above $324 but came across resistance. This led to some weakness taking the price back to the supportive trendline. The supportive trendline was formed after the earnings call which saw the stock’s price fall as much as 28%. Since then, investors have tried to recoup some of those losses. As the price is now within a narrow trading point, we may see a move of some significance in either direction. The trendline resistance above reads $301.86, a move above it would usually be taken as a bullish indication. This would prompt the buyers to then re-test the level of $324 once again. Towards the downside, the support along the trendline reads $285.84. A break below this level could be taken as an indication that momentum has stalled and a trend reversal is occurring. The bears would then target the support of $264.96 for further confirmation. The technicals are fairly neutral right now, without offering any near-term guidance. The MACD has now flattened and the RSI is in the centre, reading 51.

Tradable assets:
Min.Deposit:
Max Leverage:
FCA:

Rating:


