Test- FTSE 100 Kicks Off August on a High as BP and Senior Lead Market Momentum
$11
10 Oct 2025, 13:13
Neutral
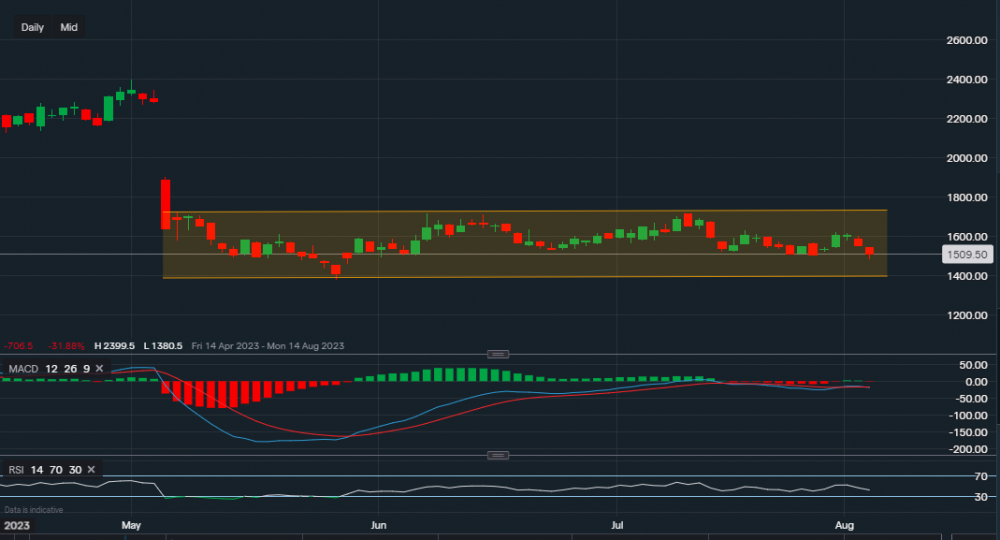
Chart & Data from IG
Paramount Global is currently trading at around $15.09 a share. At the moment, it seems like it is continuing this downward spiral it finds itself in since March 2021. This company is clearly struggling with not only the increased costs and issues in the media industry but also the competition surrounding it. Looking at the daily interval, we can see that the price is now trading within the channel drawn on the chart. The high of that channel sits at $17.18, which was set on the 7th of June, and there was a failed attempt to push higher on the 12th of July but the resistance was overpowering. Current resistance sits at $15.90 then at $16.14, a break above these two may see another attempt at the key resistance of $17.18 (as already mentioned). Towards the downside, support sits at $15.00 then at $14.61 and then the key level at $13.80. A break and close below $13.80 could just simply see the price of this stock plummet lower towards the low of $10.10. This level was last seen in March 2020. Looking at the technical indicators, MACD is basically flat and the RSI is now negative as it reads 42.


