Test- FTSE 100 Kicks Off August on a High as BP and Senior Lead Market Momentum
$11
10 Oct 2025, 13:13
Neutral
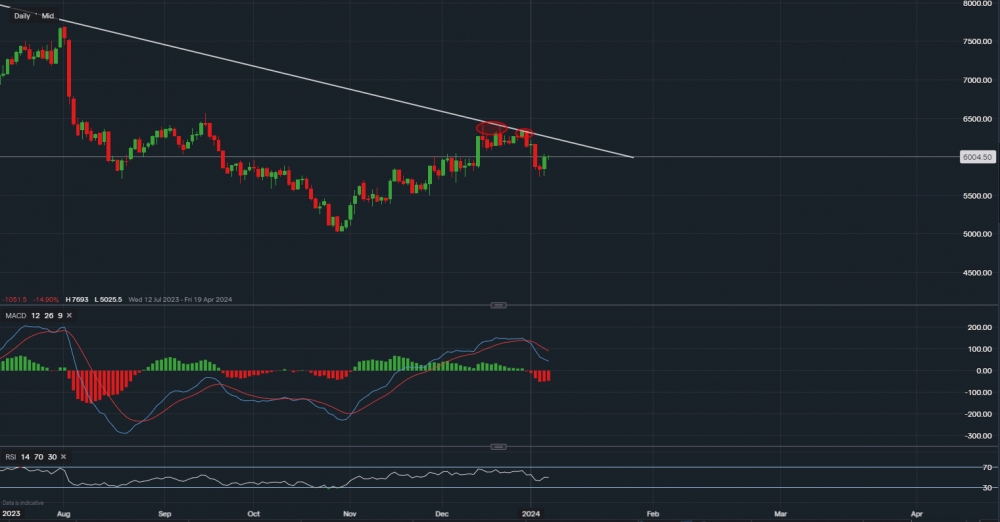
Chart & Data from IG
Taking a look at PayPal as yet another rejection has occurred along the descending trendline, which dates back to April of 2022. Currently, its share price sits around $60.04 a share. Looking at the chart from a technical aspect and based on a daily timeframe, we can see that the price was rejected in the range of $63.46-$64.11. This is highlighted by the two red ovals. Due to the overpowering resistance, the price has now retraced back to its current level. However, we can see that last Thursday a minor support level was formed, reading $57.44. The following day saw an engulfing candlestick, which tends to be a bullish indicator. Hence, over the next week or two we may see yet another attempt on the trendline resistance for a potential breakout. The resistance in focus now is $61.96 (along the trendline). As already mentioned, the support in focus is now $57.44. A break and close below it would signal that the momentum may have faded and further downside is possible. In that scenario, the focus would shift to support levels of $56.62 followed by $55.05. Looking at the technical indicators, the MACD has now turned negative due to the rejection but the RSI is neutral as it reads 49.

Tradable assets:
Min.Deposit:
Max Leverage:
FCA:

Rating:


