Test- FTSE 100 Kicks Off August on a High as BP and Senior Lead Market Momentum
$11
10 Oct 2025, 13:13
Neutral
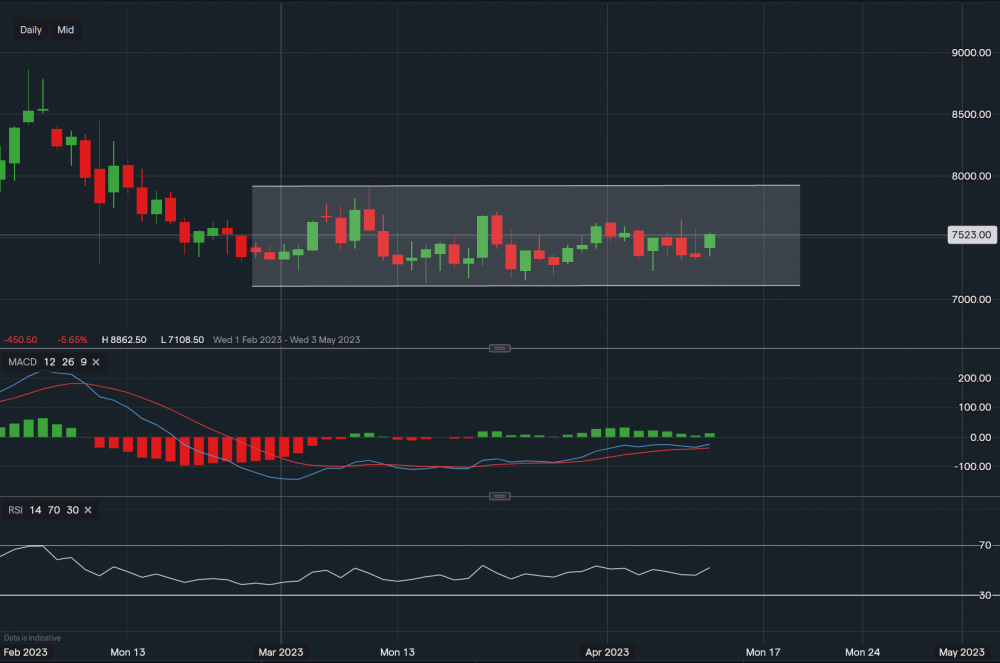
Chart & Data from IG
PayPal seems like it may have found a base after months of getting hammered down. Since January 2022 its stock is down just over 60% to date, but there may be hope for investors as its price looks like it’s trying to consolidate. Up 2.4% on the day so far. The price is rangebound for the time being in the channel shown on the chart, with resistance sitting at $76.31 then at $77.10 then followed by a major level at $79.26 (upper trendline of the channel). A break above the major level could see the price rise higher with the target between $80.70 to $82.53. Towards the downside, key support sits along the bottom trendline of the channel at $71.08. A break and close below this price level may see a fall to as low as $66.38, which was the low of December 2022. Looking at the technical indicators, MACD is positive and RSI is neutral as it reads 52. On the monthly timeframe, the MACD seems to be levelling out which some would say is a positive sign (as it sometimes means a change in momentum). However, investors should be wary when trading/investing as there hasn’t been a clear sign towards either direction as of yet.


