Test- FTSE 100 Kicks Off August on a High as BP and Senior Lead Market Momentum
$11
10 Oct 2025, 13:13
Neutral
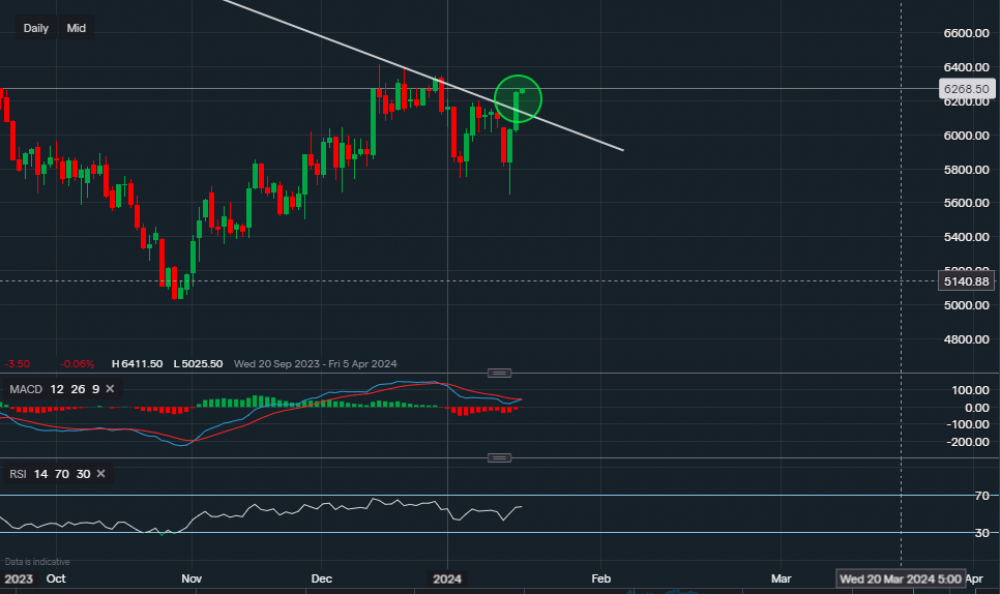
Chart & Data from IG
PayPal may have finally broken out of the two-year bearish trend, however, it is not yet clear. Currently, its shares are now trading at around $62.68 a share after a strong close in yesterday’s session. Looking at the chart, we can see the price closed above the descending trendline resistance, closing near the high of the day. From a technical aspect, this is a bullish indication alongside with the break above. It seems like the price found support at $58.40, which was later tested leading to the momentum for a push higher. Sometimes, markets tend to have a small pullback after a breakout, testing the previous resistance which then acts as support. Hence, the support along the trendline currently reads $61.25. A move back below the trendline would be a bearish signal and could see yet another test of $58.40. The next key resistance here now for the bulls is the small cluster to the left of the chart, ranging between $63.40-$64.11. Right now, the technical indicators seem more positive than negative. The MACD looks like it could turn positive and the RSI is now positive as it reads 57.

Tradable assets:
Min.Deposit:
Max Leverage:
FCA:

Rating:


